Tag

acquisition financing

7 insights

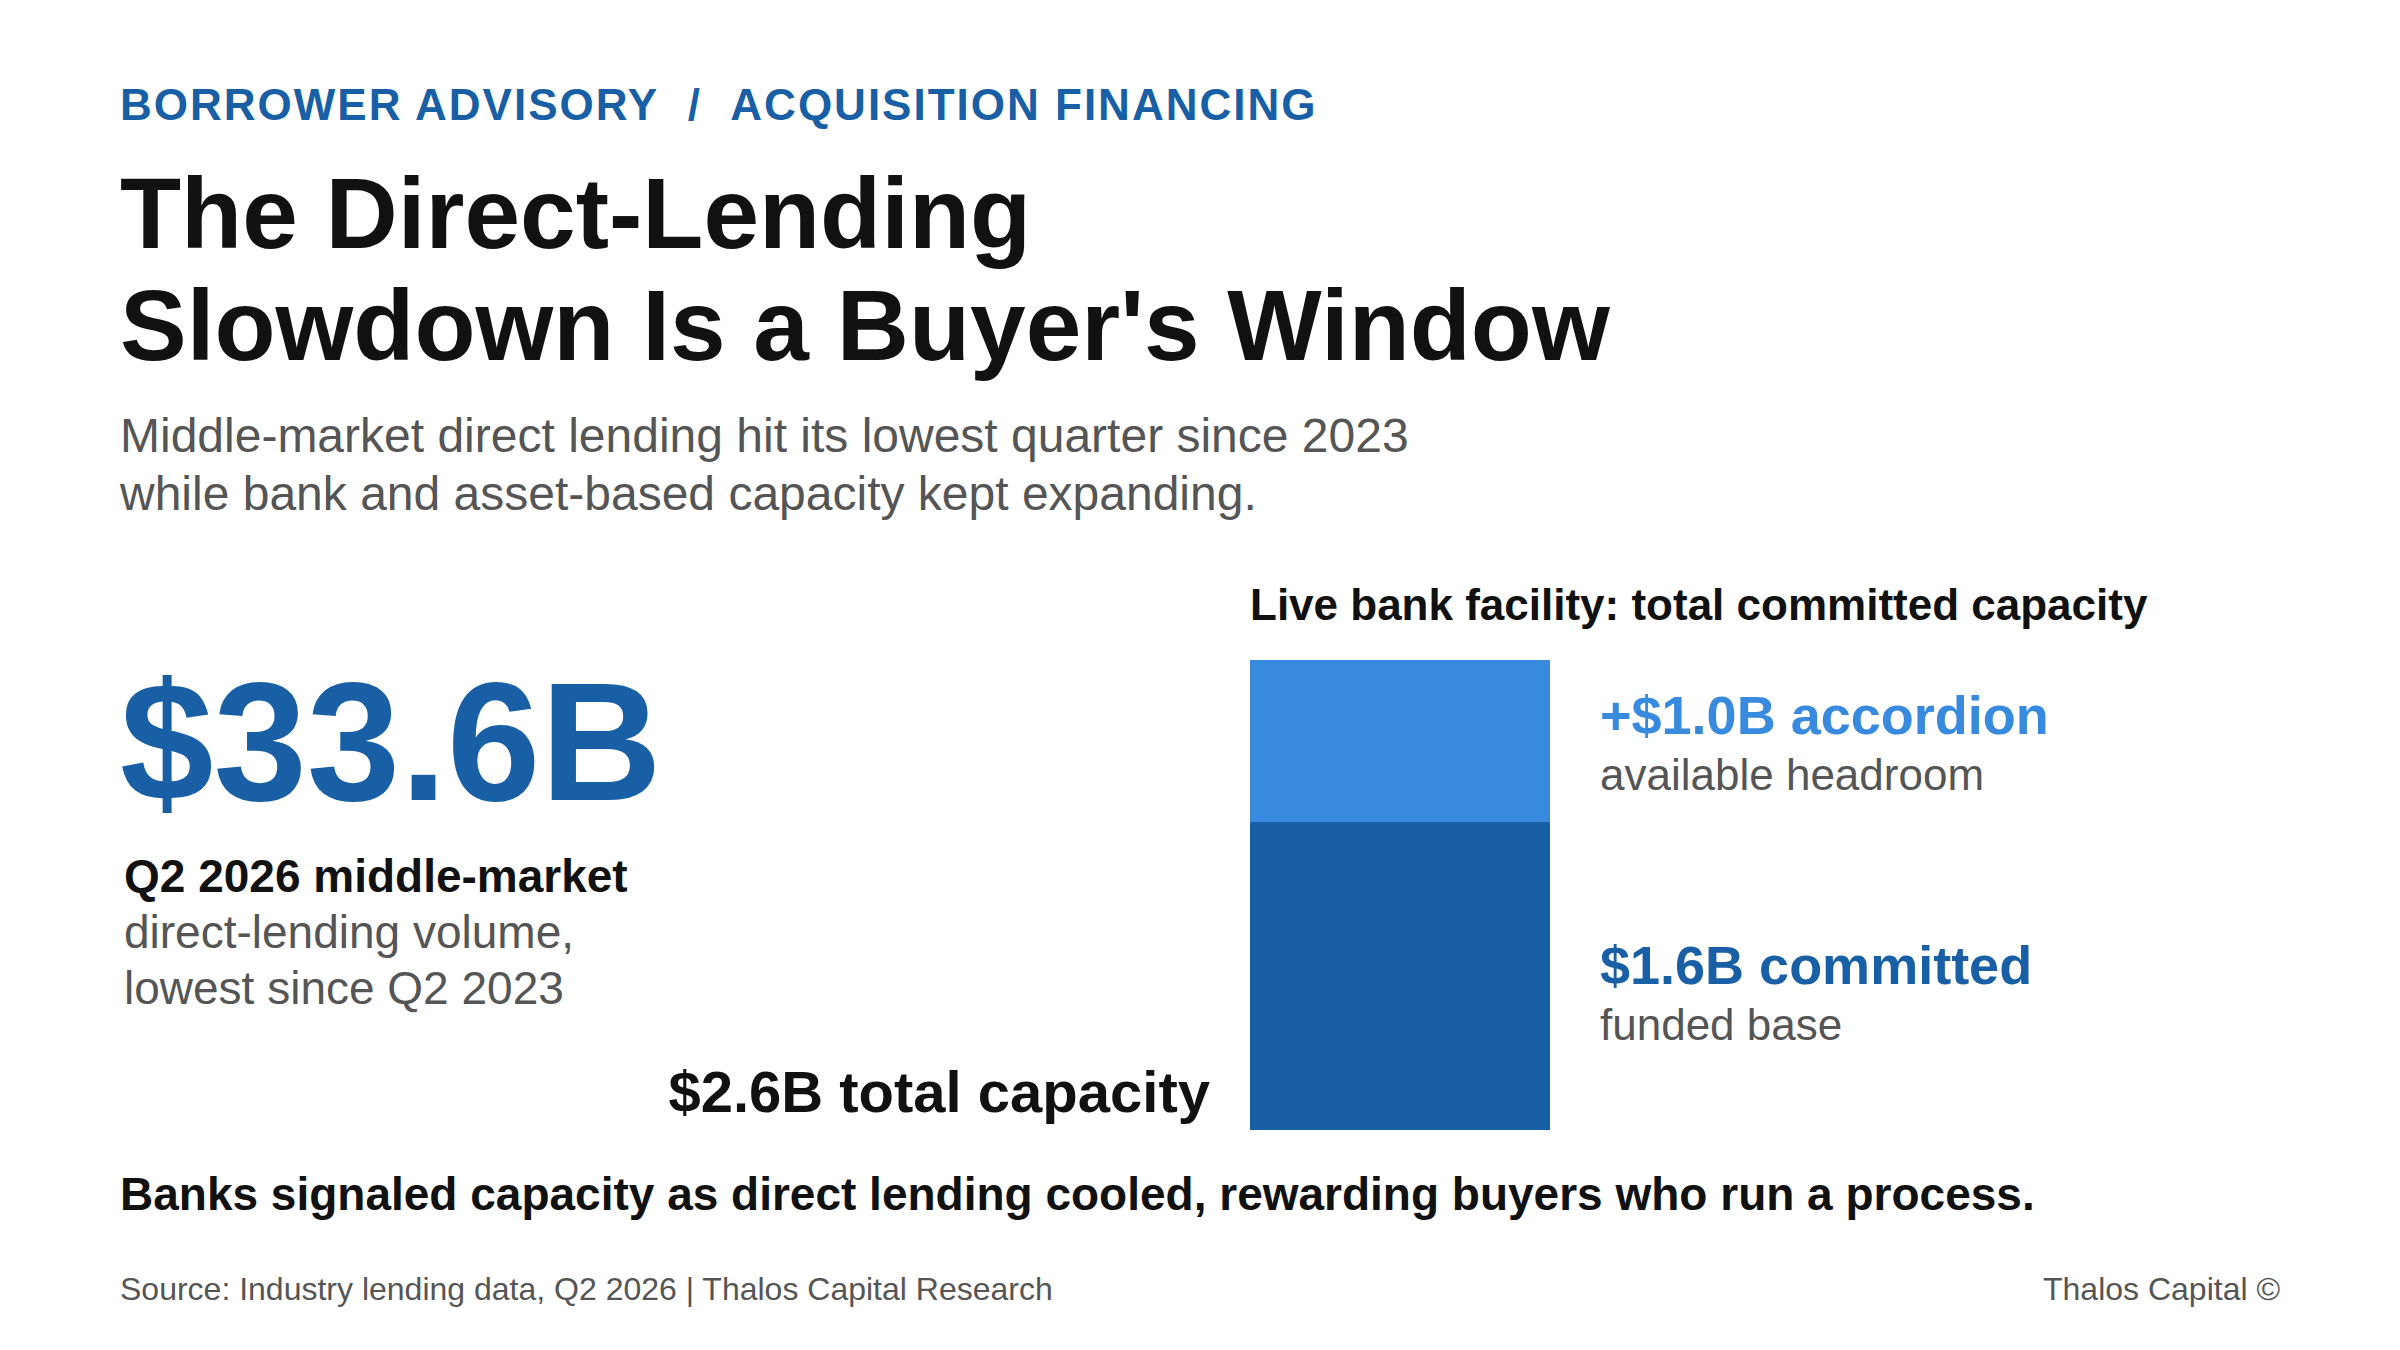
Cover showing Q2 2026 middle-market direct-lending volume of $33.6 billion, the lowest since Q2 2023, beside a stacked bar of a bank facility's $1.6 billion committed capacity plus a $1.0 billion accordion to $2.6 billion.

The Direct-Lending Slowdown Is a Buyer's Financing Window

Middle-market direct lending hit its lowest quarter since 2023 while bank and asset-based capacity expanded. Why the buyers who run a multi-source process capture the leverage.
Read More
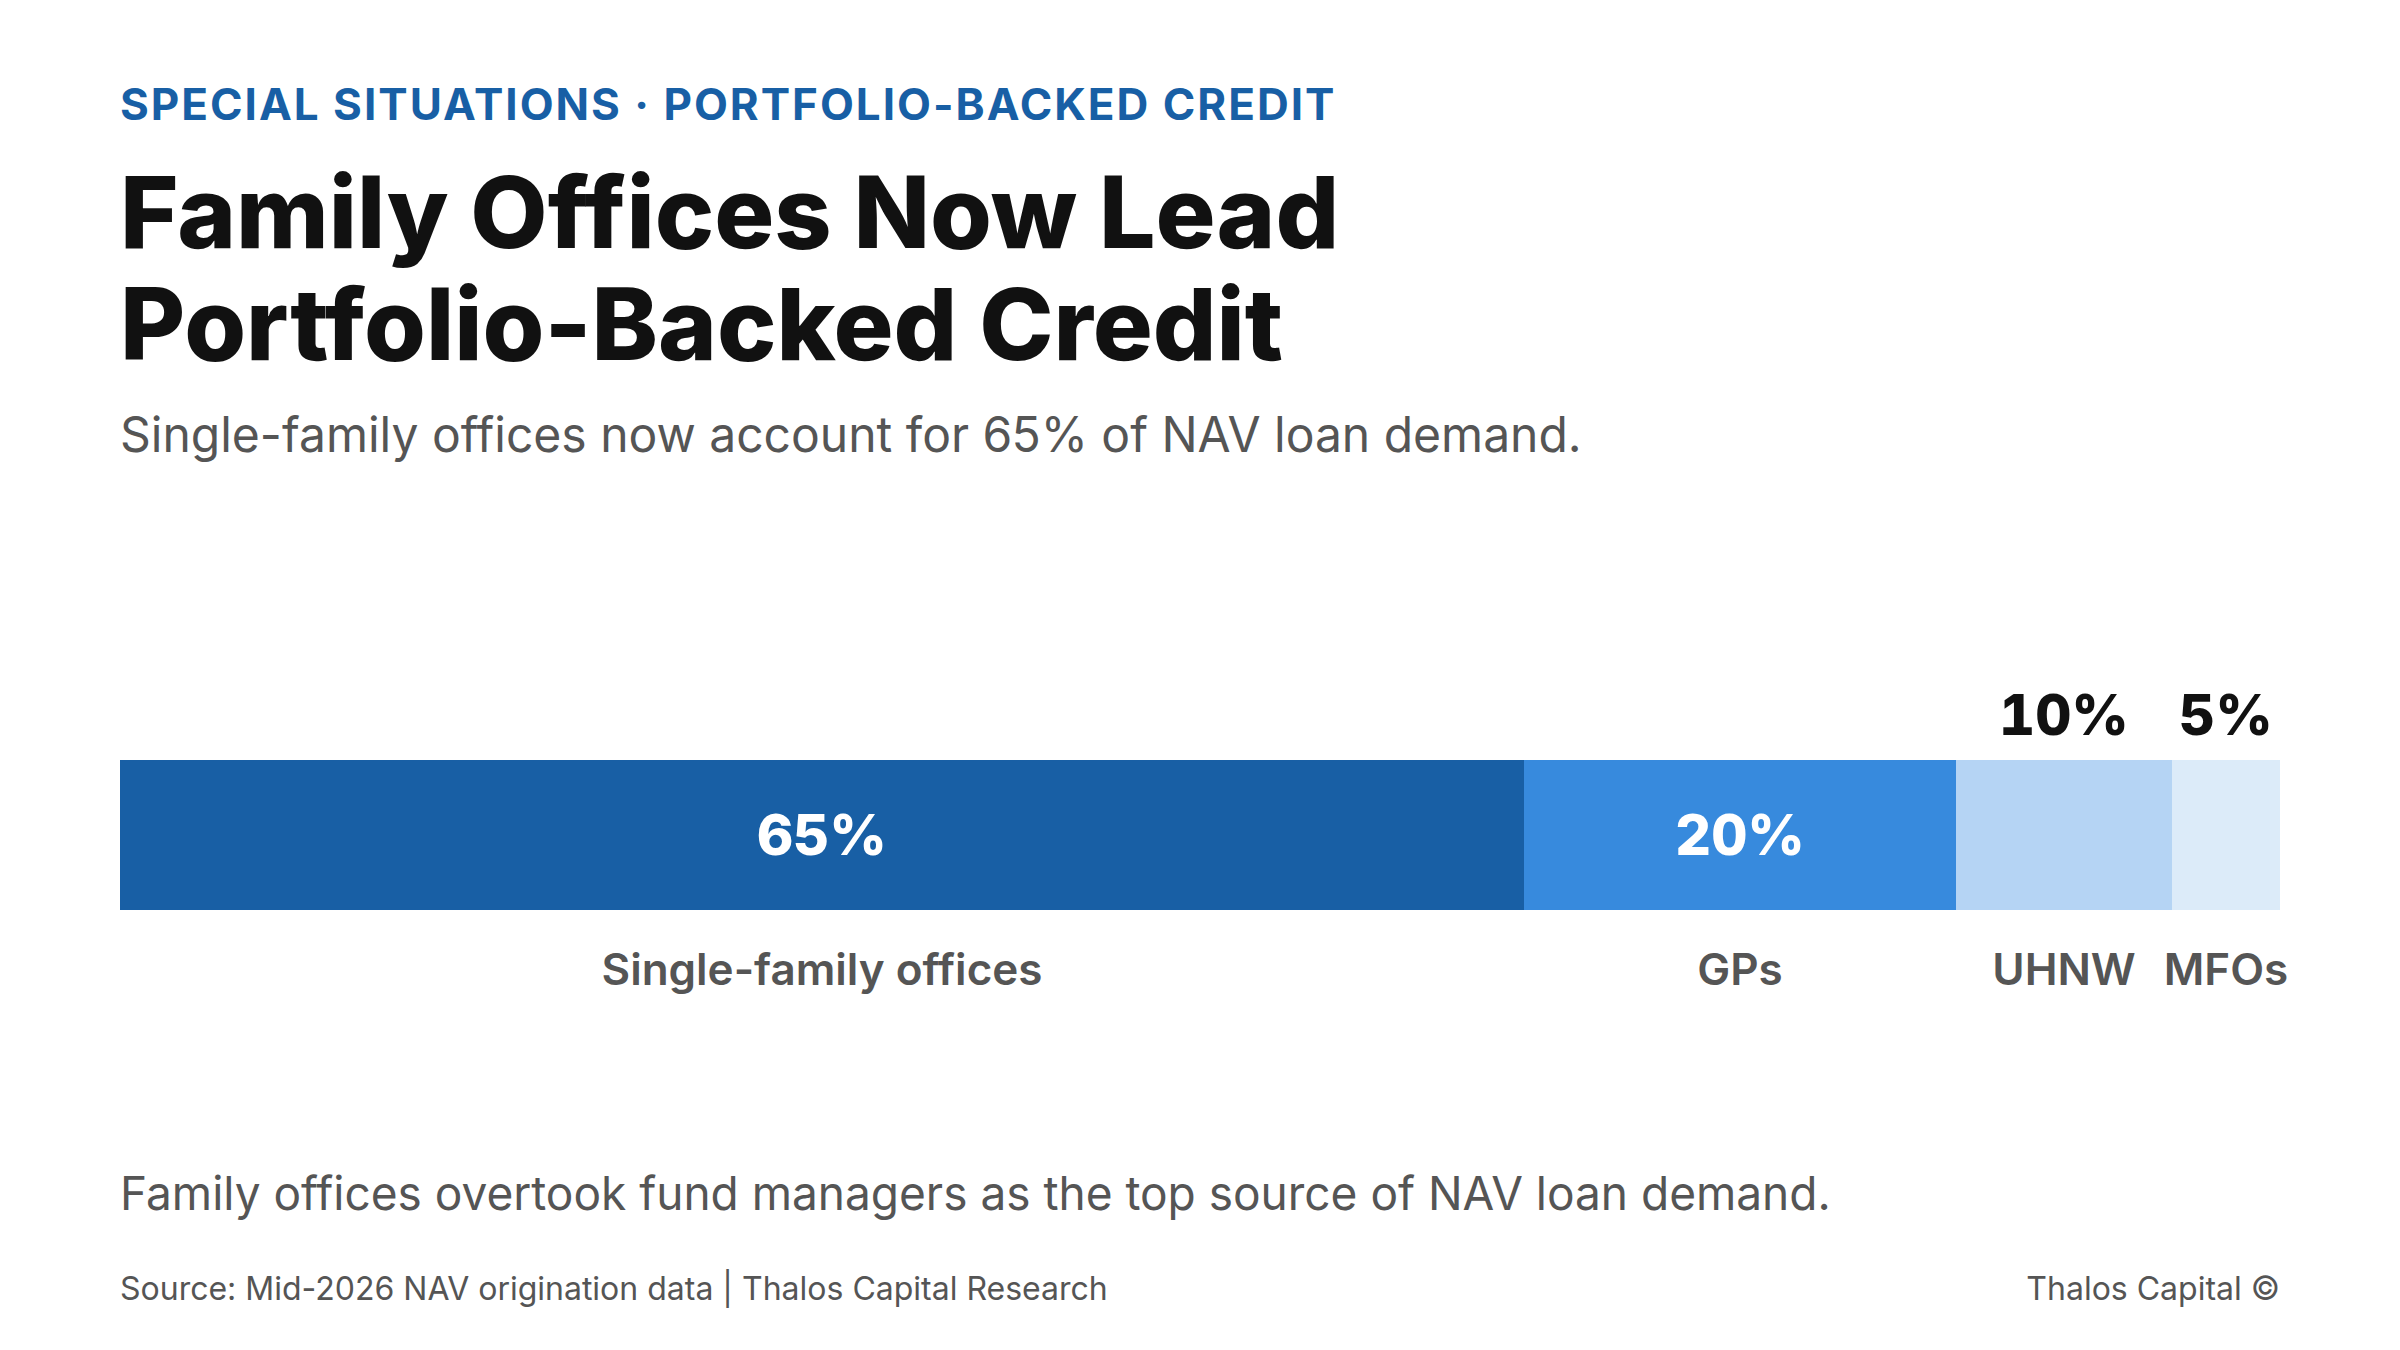
Stacked bar showing single-family offices at 65 percent of NAV loan demand, ahead of general partners, UHNW individuals, and multi-family offices.

Family Offices Now Lead Demand for Portfolio-Backed Credit, and They Are Borrowing to Acquire

Single-family offices now drive 65% of NAV loan demand, and 85% of that borrowing funds acquisitions, not distributions. What the shift means for owners financing against a portfolio.
Read More
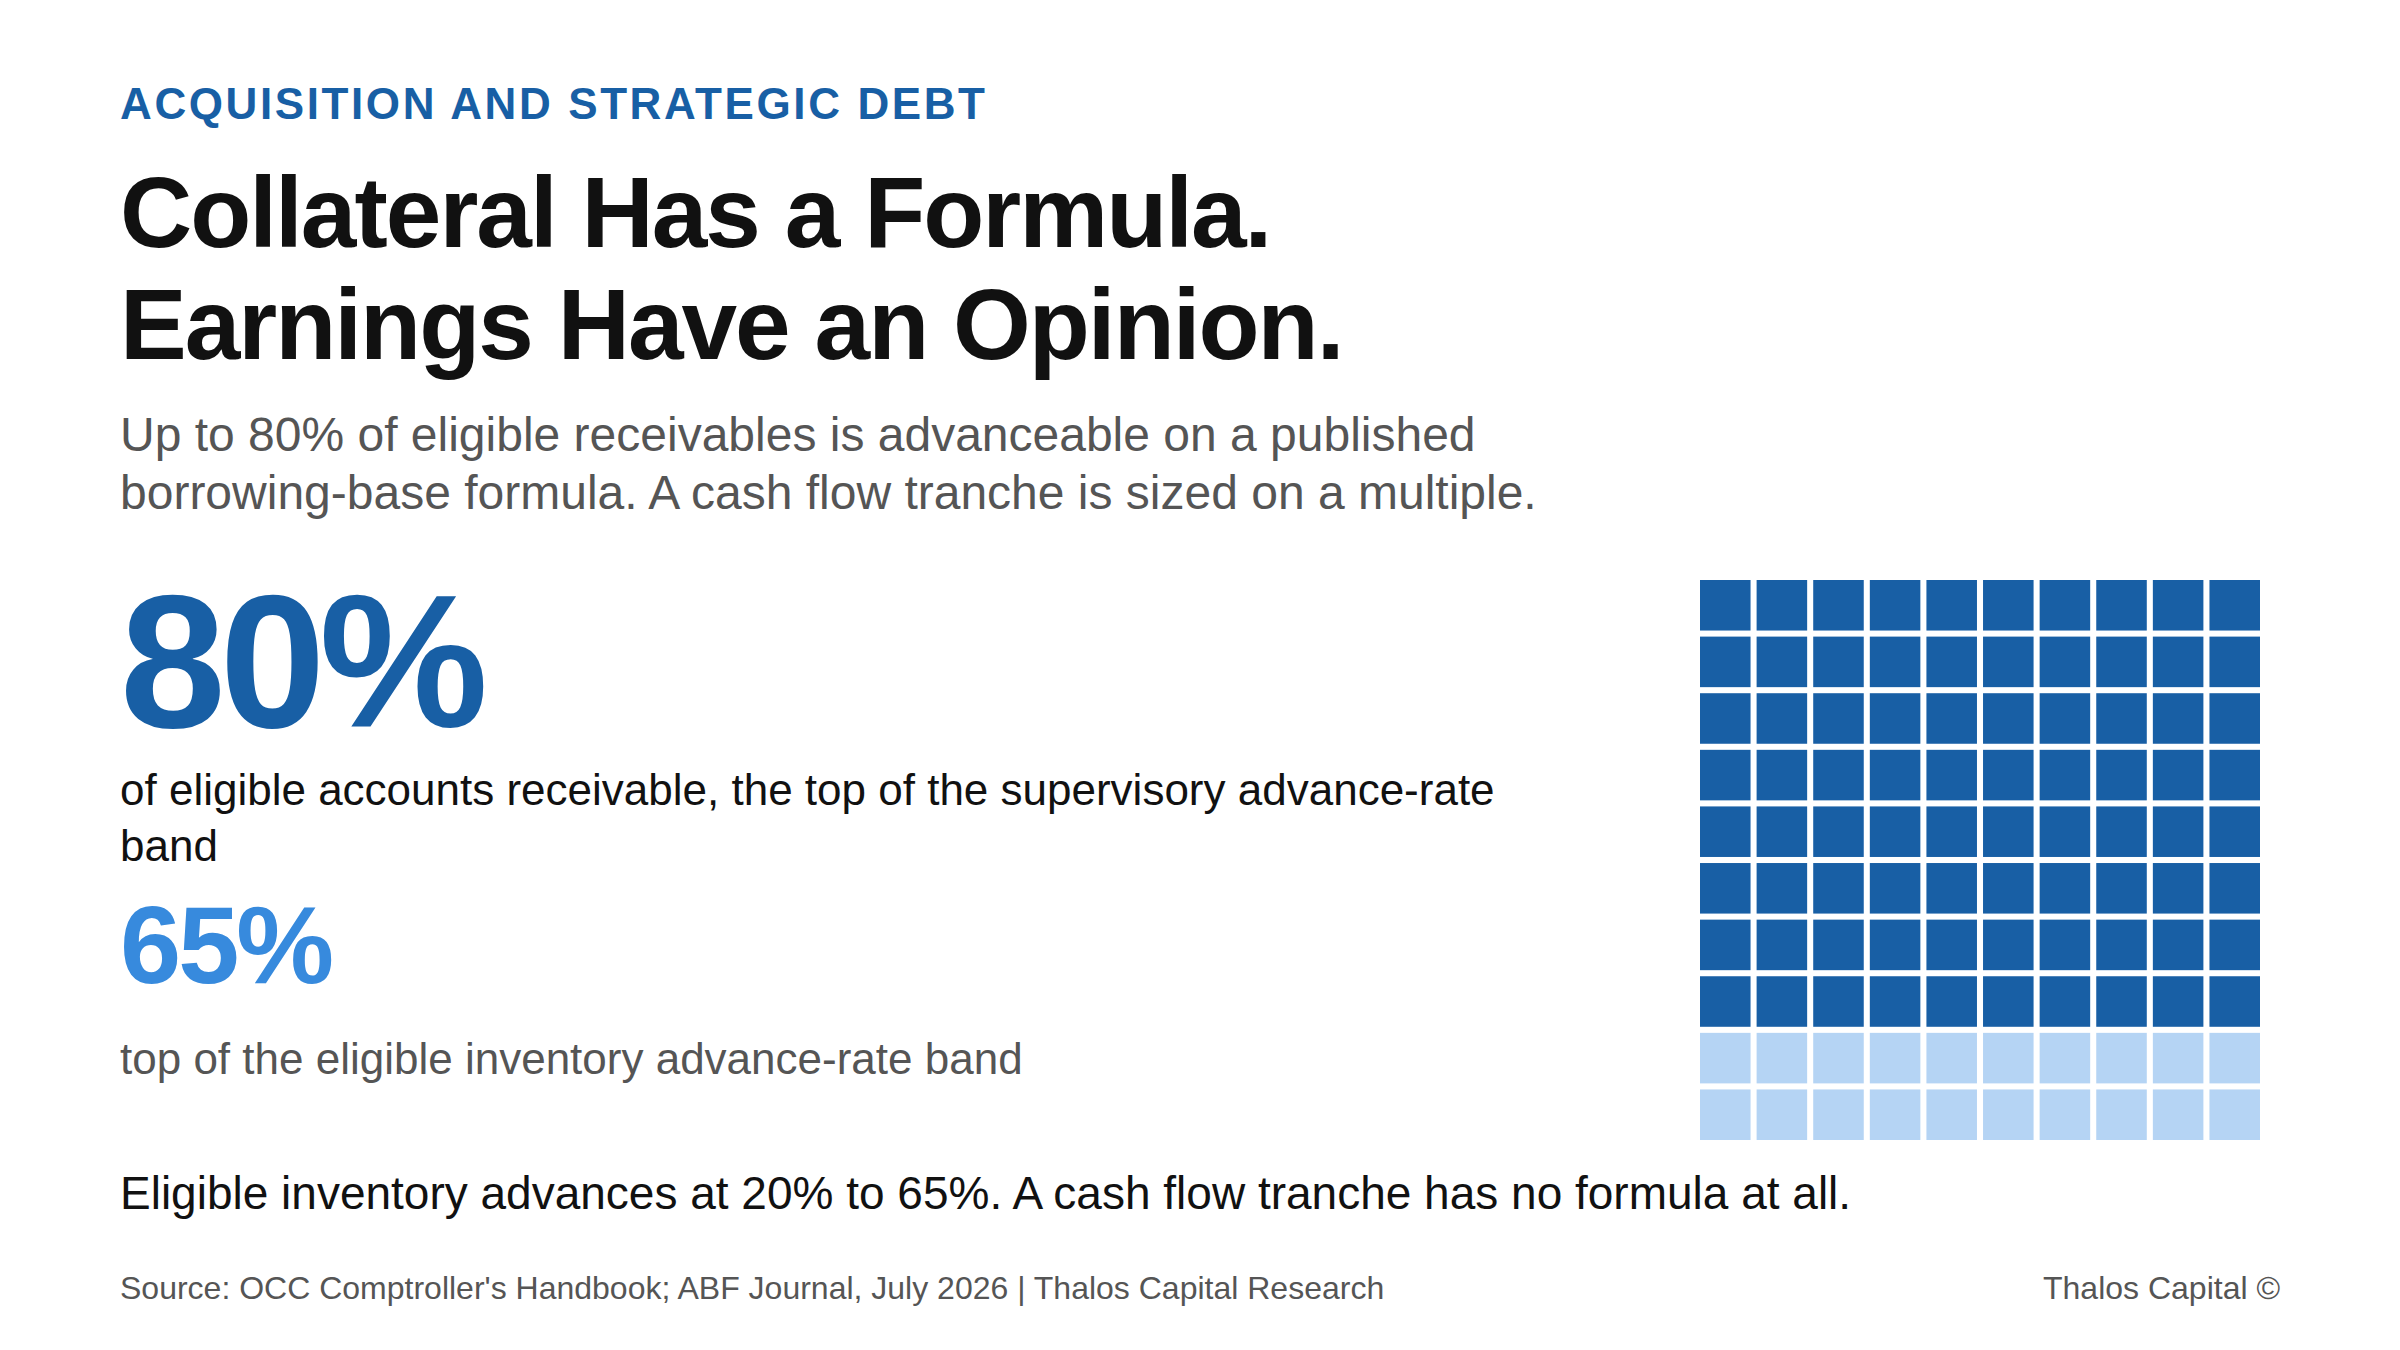
Squares pictogram showing 80 of 100 filled, representing the top of the 70 to 80 percent advance-rate band on eligible accounts receivable under a borrowing-base formula, with the 65 percent eligible inventory ceiling shown alongside.

You Are Buying a Balance Sheet and Financing It Like a Cash Flow Statement

Two facilities priced 200 to 250 basis points apart in the same week. The difference was collateral, not credit. Why acquisition debt sized only on EBITDA leaves both pricing and capacity on the table.
Read More
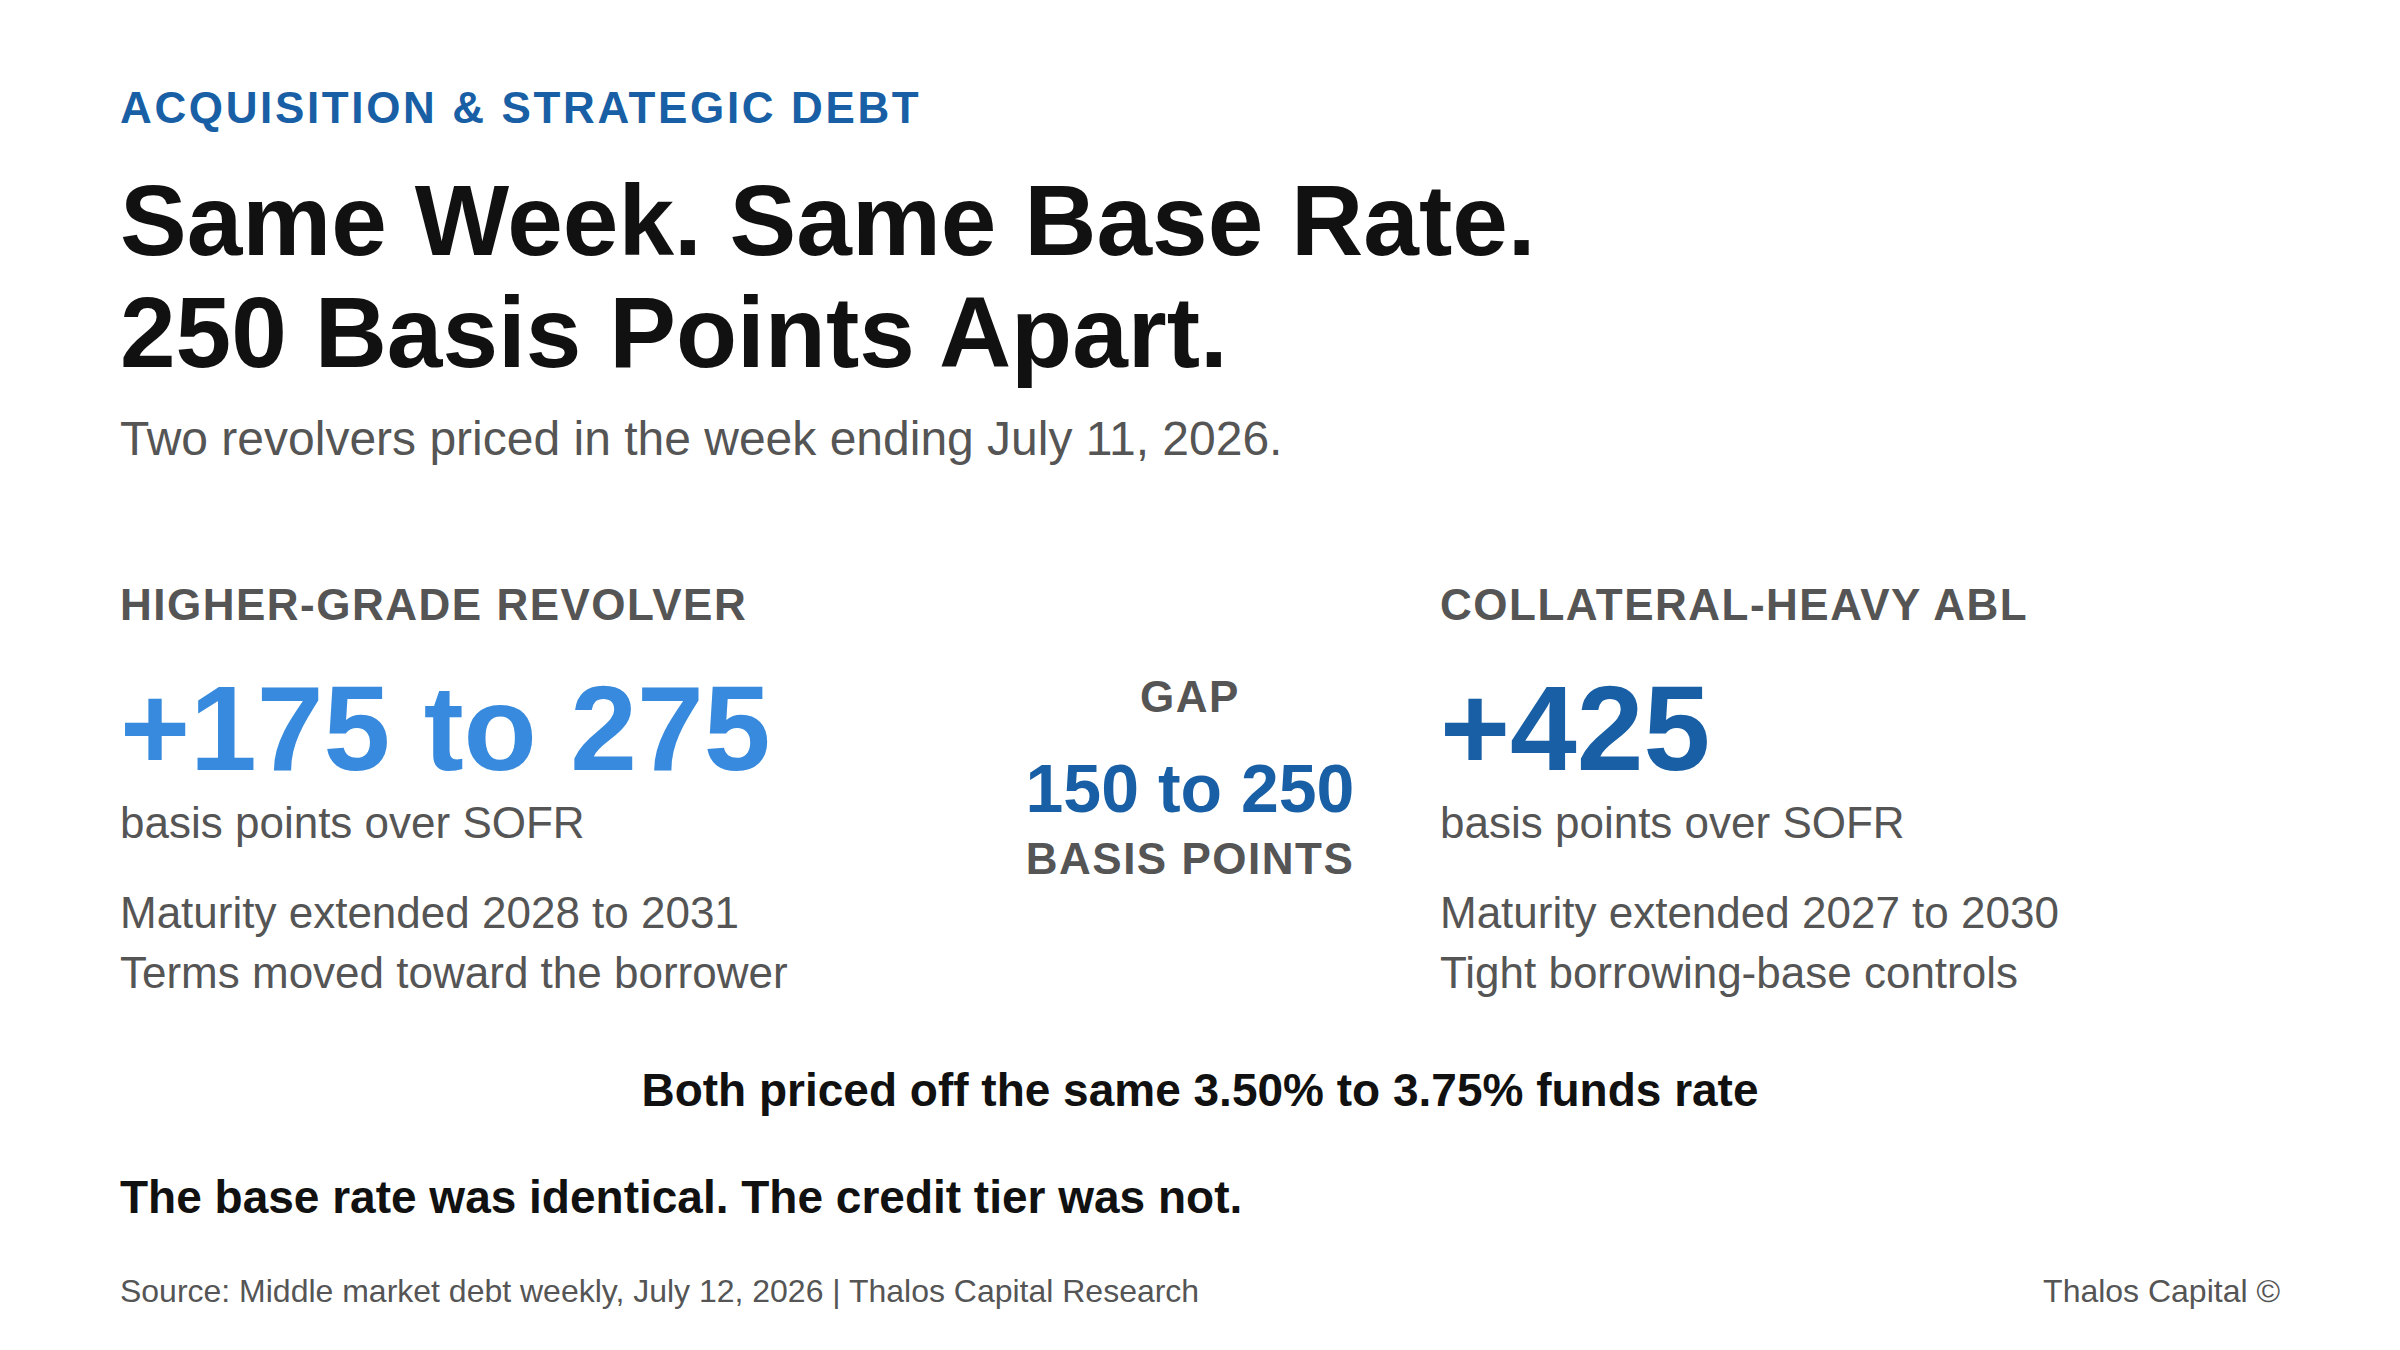
Contrast chart showing a higher-grade revolver priced at 175 to 275 basis points over SOFR against a collateral-heavy asset-based revolver at 425 basis points, both priced off the same 3.50% to 3.75% funds rate.

Same Week, Same Base Rate, 250 Basis Points Apart

Two revolvers priced in the same week of July 2026 carried spreads 150 to 250 basis points apart on an identical base rate. The difference was credit tier, and tier is something a borrower can change.
Read More
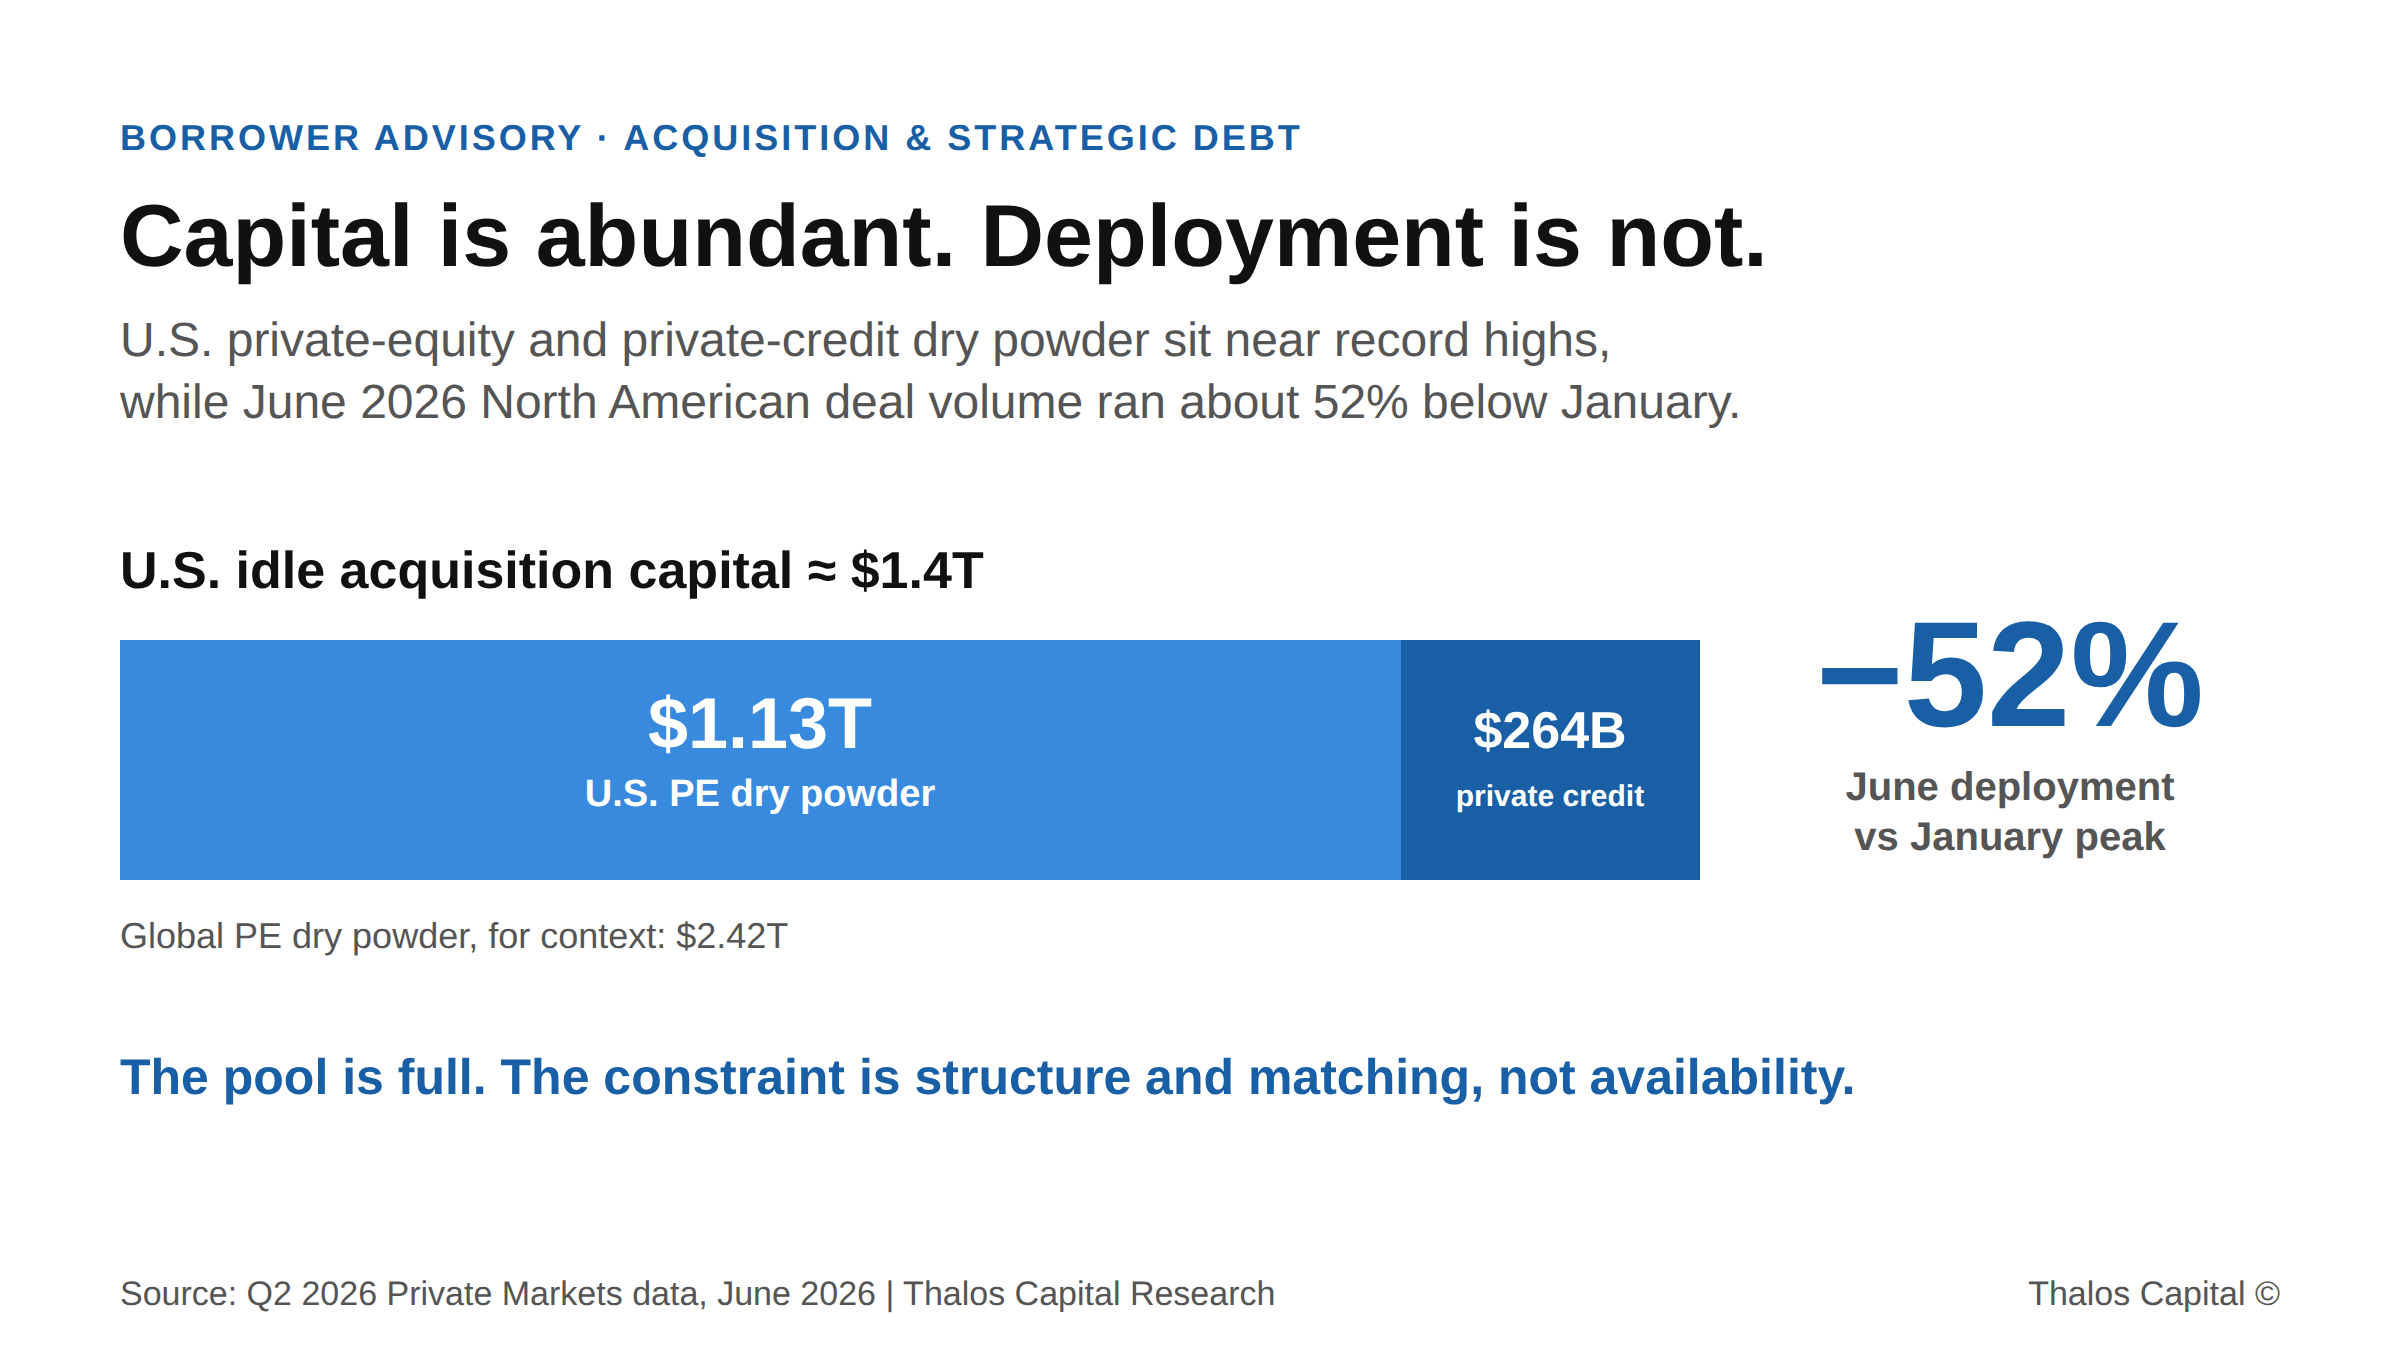
Horizontal stacked bar showing about $1.4T of idle U.S. acquisition capital, split into $1.13T PE dry powder and $264B private-credit dry powder, against a −52% drop in June 2026 deal deployment versus January.

Capital Is Not Scarce. It Is Just Not Moving.

U.S. acquisition capital sits near record levels while deal volume has fallen by half. The binding constraint for buyers now is structure and matching, not availability.
Read More
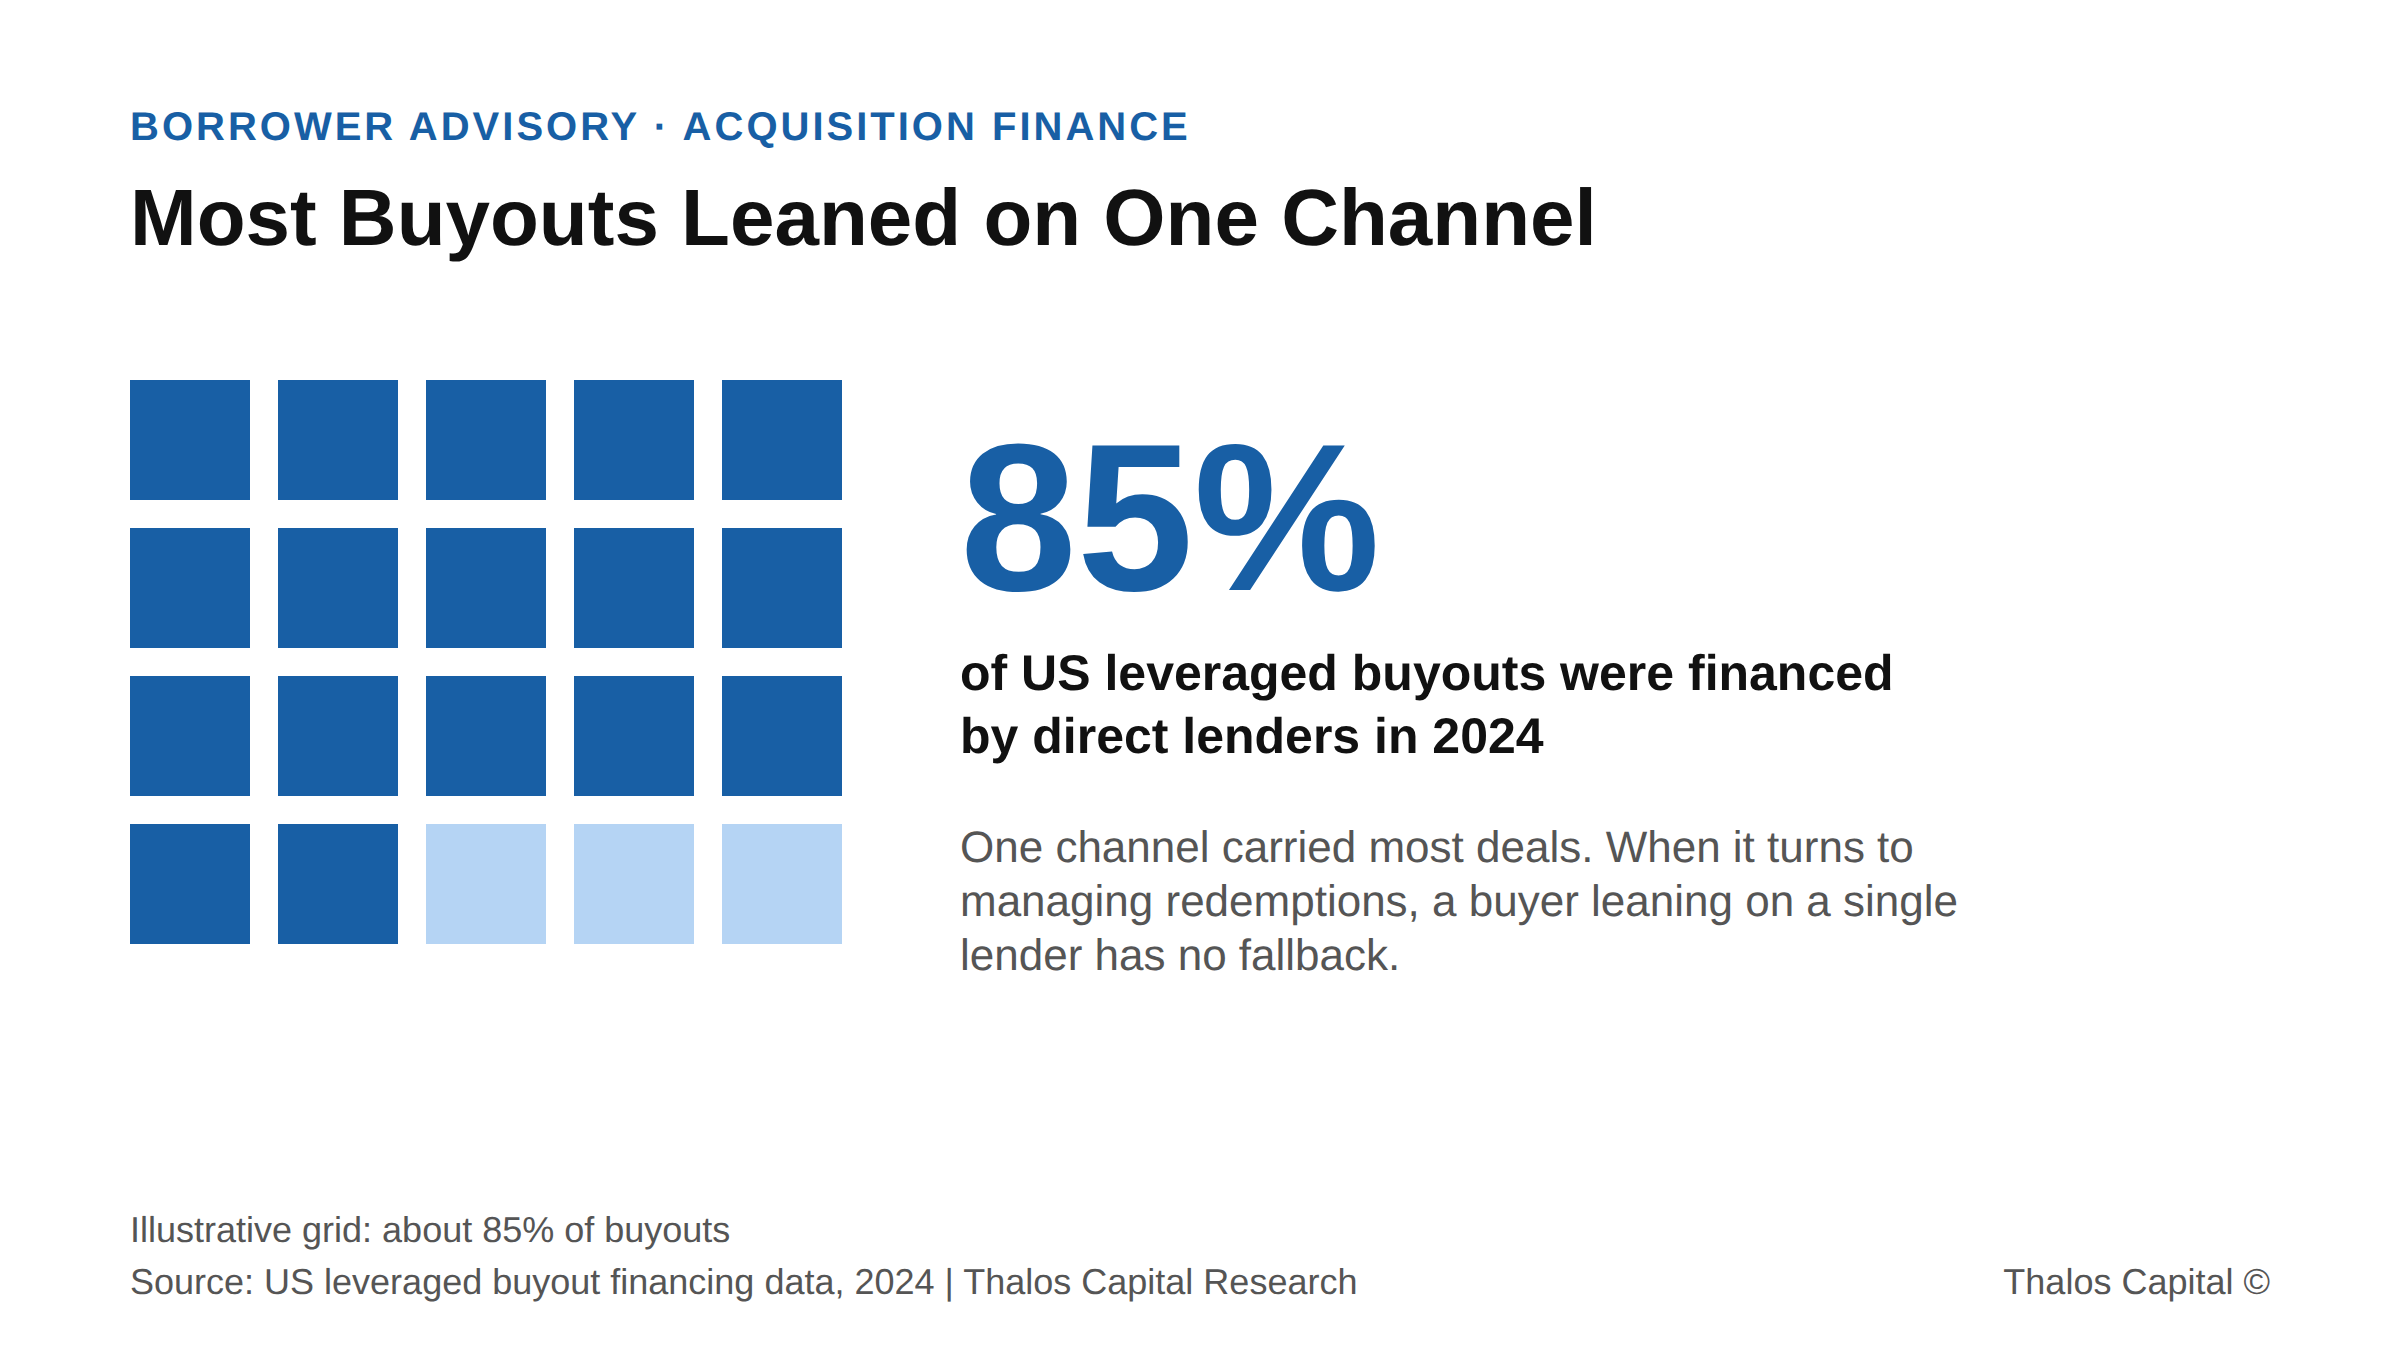
Grid of 20 squares with 17 filled in Thalos navy, illustrating that direct lenders financed about 85% of US leveraged buyouts in 2024.

The Single-Lender Acquisition Is Narrowing Just as Deal Flow Returns

Private credit redemptions jumped 217% in a quarter. For acquirers leaning on one lender, the risk is no longer deal supply, it is certainty of close. Here is the defense.
Read More
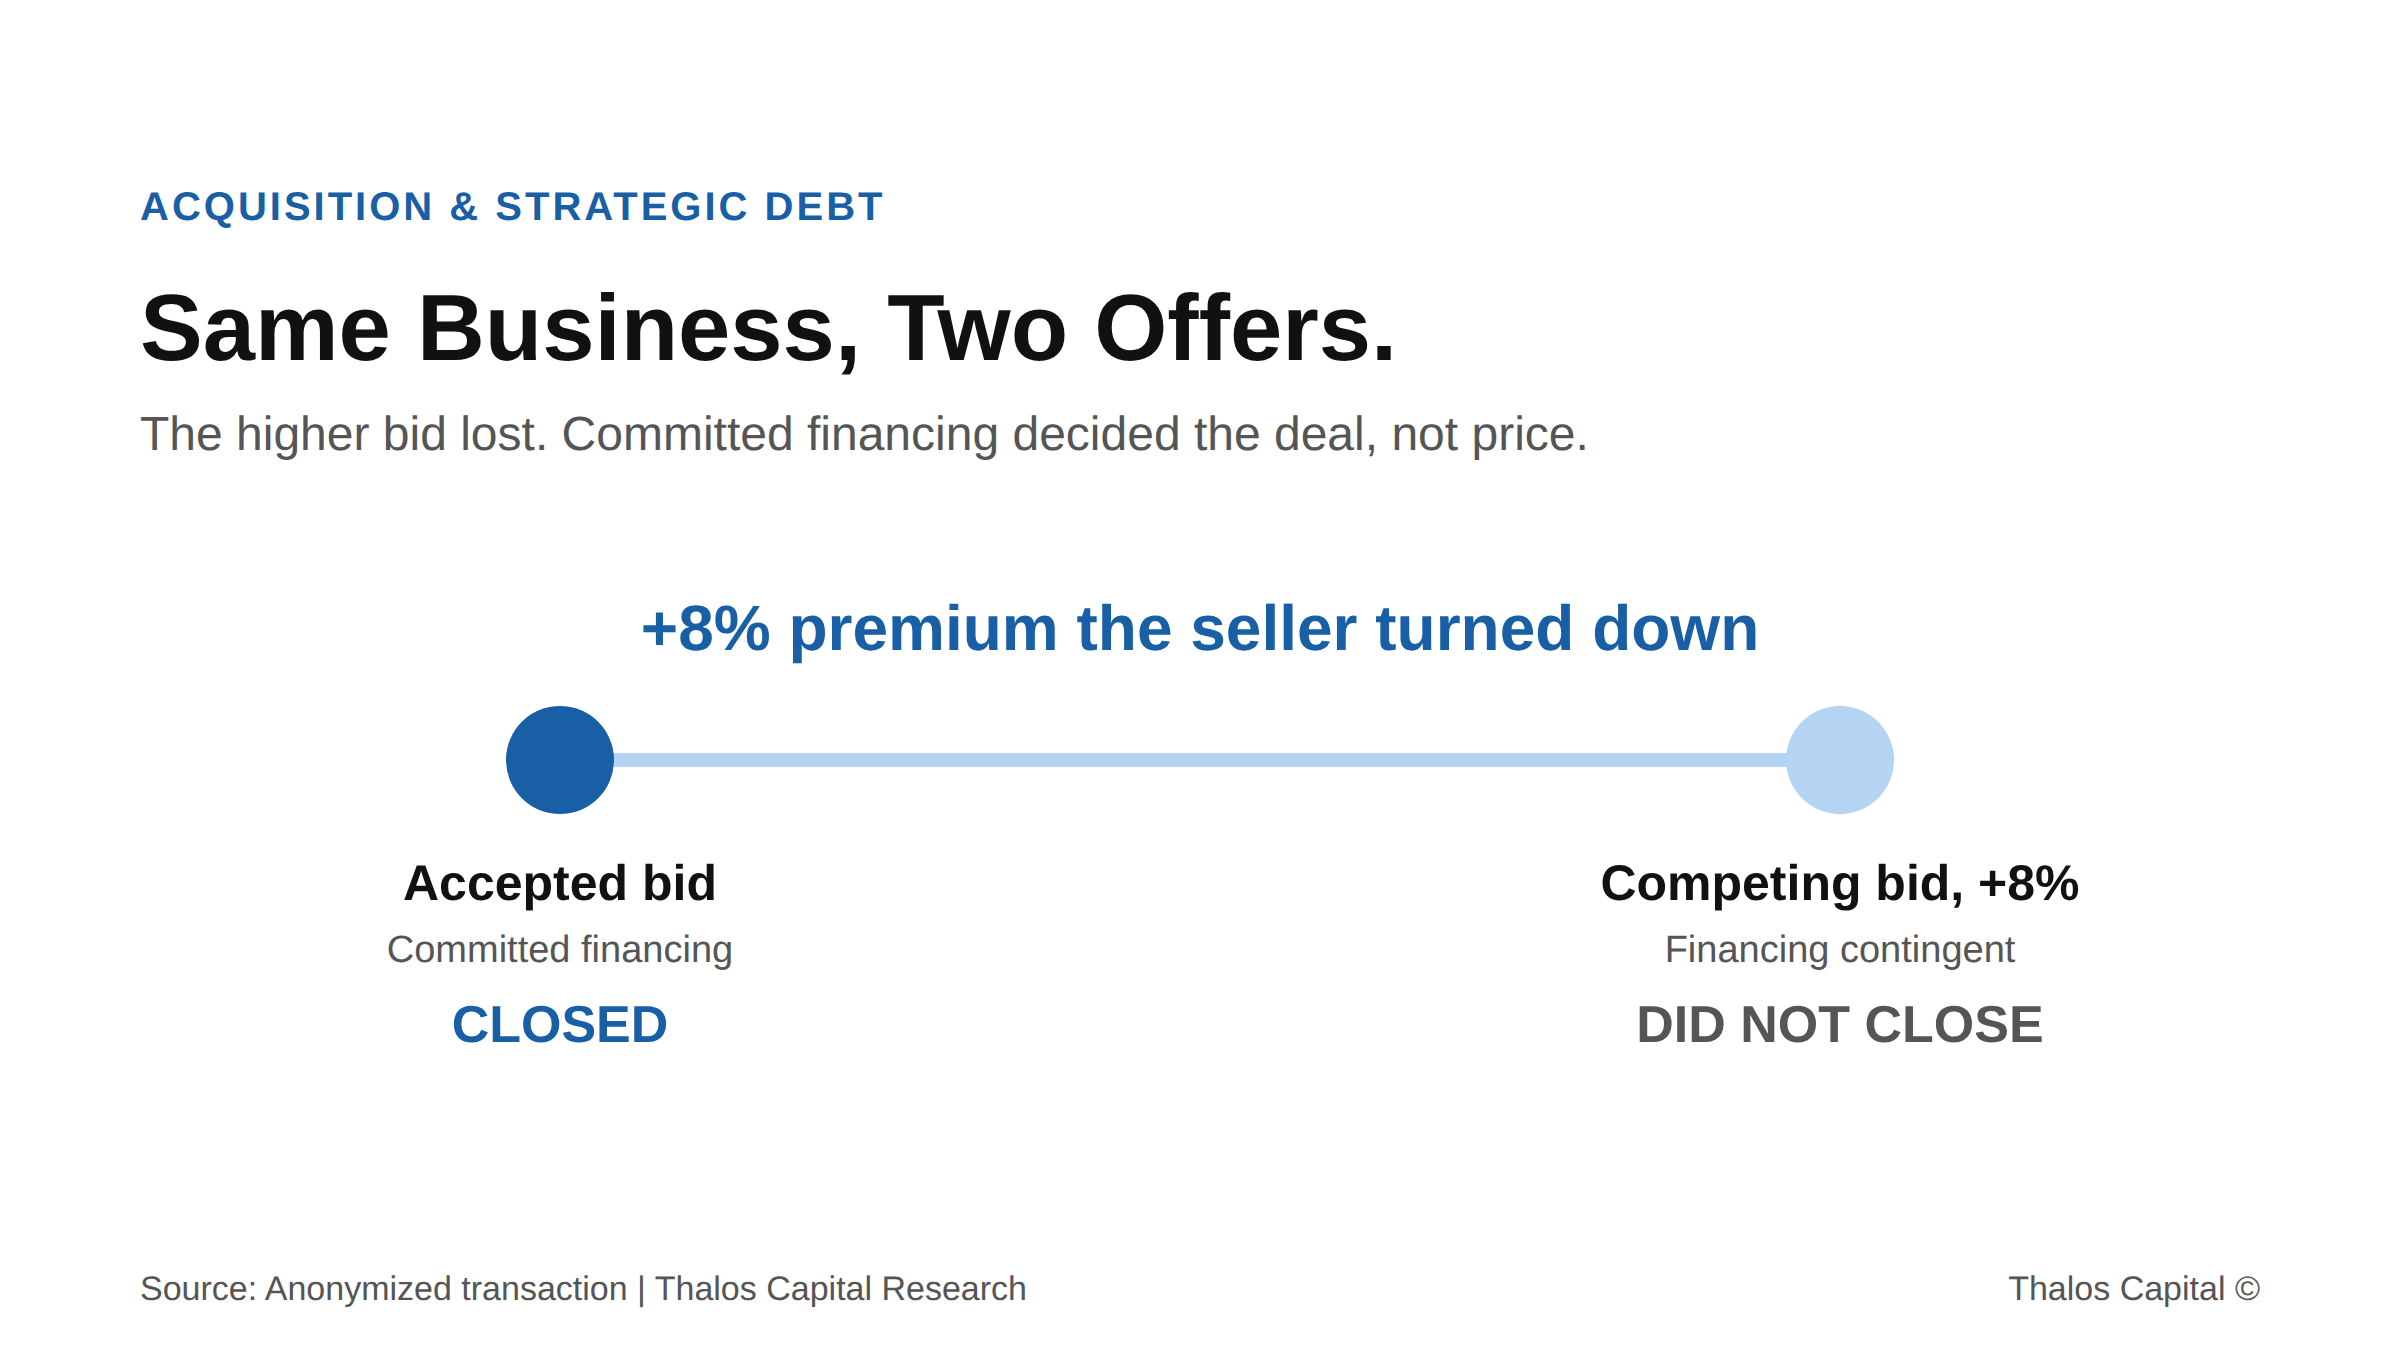
Two-point range comparing two offers for the same business, showing an accepted bid with committed financing that closed and a competing bid roughly 8 percent higher with a financing contingency that did not close.

Same Business, Two Offers: Why the Lower Bid Won

A higher bid lost to a lower one backed by committed financing. In 2026's busy M&A market, structure and certainty of close decide which acquisition offer a seller actually takes.
Read More
Working through a financing decision?
Insights are a starting point. A conversation maps your actual options.
Tell us what you are financing and we will map the structures and sources that fit.
Submit your financing request →
Explore our financing solutions
Equipment FinancingWorking CapitalAsset-Based LendingStrategic Debt