Category

Business Case & ROI

17 insights

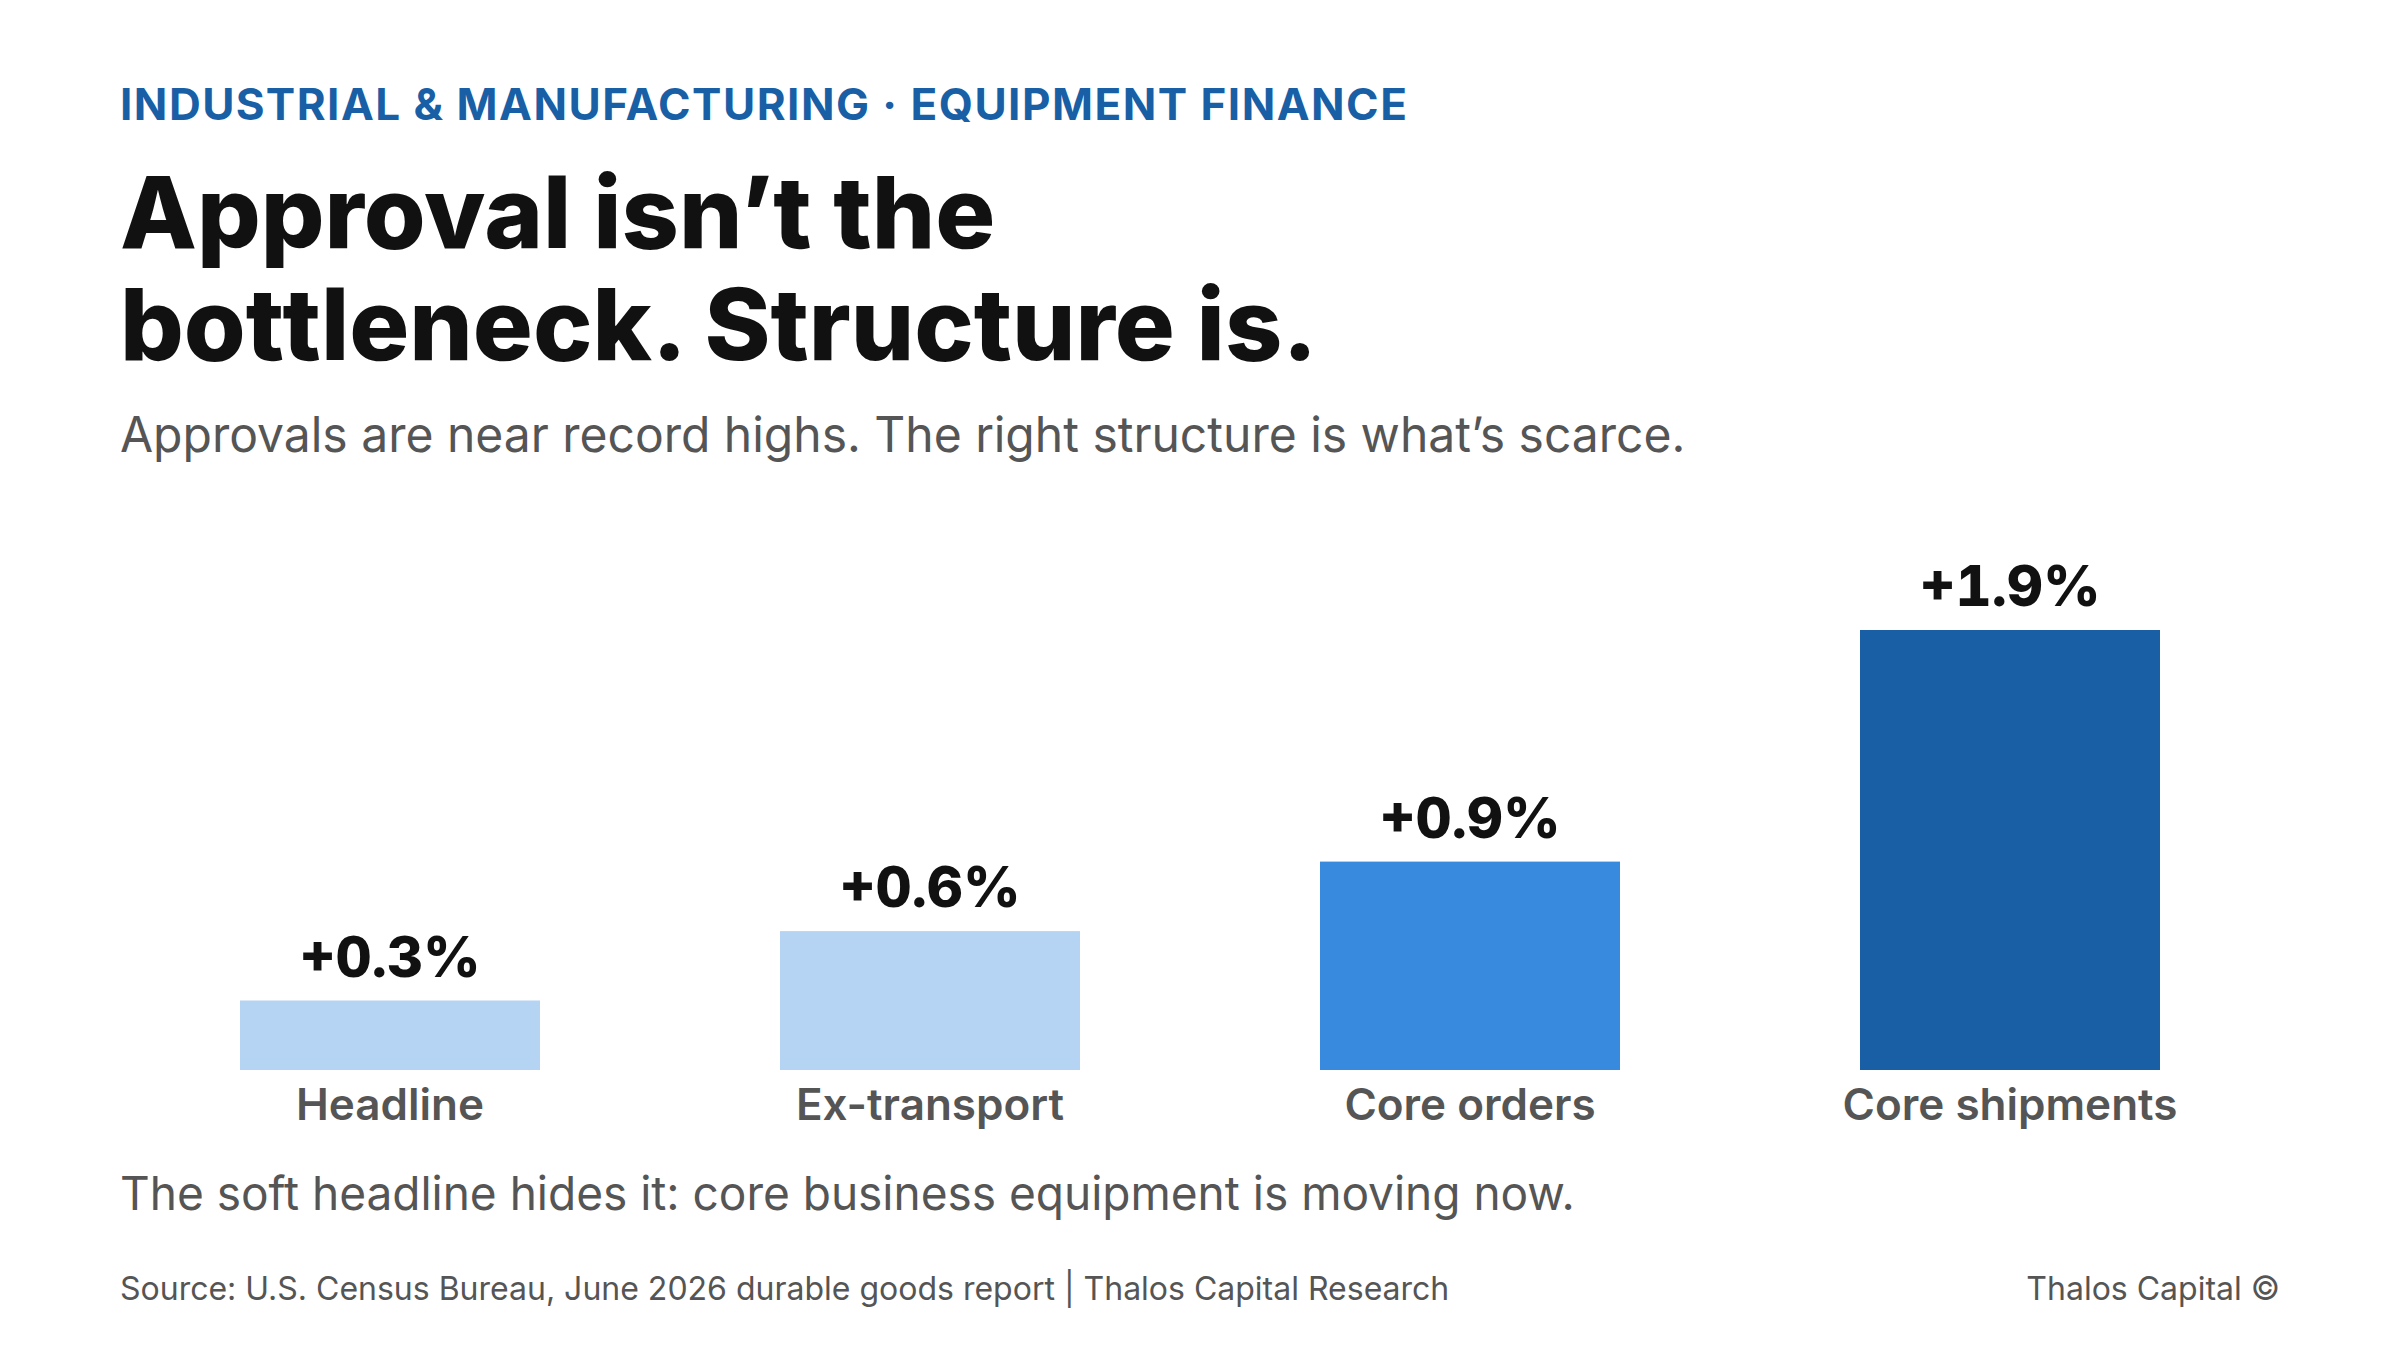
Bar chart of June 2026 durable goods month-over-month change: headline +0.3%, ex-transportation +0.6%, core capital goods orders +0.9%, core capital goods shipments +1.9%, showing strong core business equipment activity.

The Equipment Is Already Shipping. The Financing Decision Should Not Lag It.

Core business-equipment shipments rose 1.9% in June and equipment-finance approvals sit near record highs. For manufacturers, the constraint is no longer approval. It is how the financing is structured against the asset.
Read More
Trend line showing global AI infrastructure spending rising from $153B in 2024 to a forecast $497B in 2026 and $1.08T in 2029, with a callout that storage took 2.4 percent of Q1 2026 spending.

The Storage Refresh You Deferred Comes Due at 2026 Prices

Storage took 2.4% of Q1 2026 AI infrastructure spending. That deferral is expiring into a component market that has repriced every quarter. What it costs, and how to structure the refresh.
Read More
Squares pictogram showing 80 of 100 filled, representing the top of the 70 to 80 percent advance-rate band on eligible accounts receivable under a borrowing-base formula, with the 65 percent eligible inventory ceiling shown alongside.

You Are Buying a Balance Sheet and Financing It Like a Cash Flow Statement

Two facilities priced 200 to 250 basis points apart in the same week. The difference was collateral, not credit. Why acquisition debt sized only on EBITDA leaves both pricing and capacity on the table.
Read More
Shaded grid of software categories showing similar 8 to 9 percent revenue growth priced from 1.4x to 3.0x forward revenue as of July 19, 2026.

Two Companies, the Same $6M ARR, Priced Two Turns Apart: The Gap Is Narrative, Not Revenue

Two software companies at the same $6M ARR can be priced two turns of revenue apart on category narrative alone. Here is what that gap costs in dilution, and the non-dilutive debt alternative.
Read More
Stacked bar showing $2.3 billion of $3.0 billion in one quarter's average loan growth at a large U.S. regional bank was commercial and industrial, driven by higher utilization rather than new borrowers.

Rising Revolver Utilization Is a Liquidity Signal, Not a Growth Signal

Middle-market commercial balances are rising on higher revolver utilization, not new borrowers. With SOFR at 3.63% and September hike odds at 63%, a drawn line funding permanent assets costs twice.
Read More
Comparison of two paths to owner liquidity showing a sale ending ownership at zero percent versus a recapitalization advancing 40 to 60 percent of appraised value while retaining 100 percent ownership.

Liquidity Without a Sale: The Recapitalization Most Owners Never Model

Selling is not the only way to get liquidity out of a business. A recapitalization releases owner cash while keeping the asset and the upside. Here is how it works and when to use it.
Read More
Waffle chart showing 60 of 100 squares in dark navy, representing the 60 percent of online-lender borrowers who reported borrowing costs higher than expected, compared with 32 percent at large banks.

Collateral Verification Is Now the First Diligence Question, Not the Last

Sixty percent of online-lender borrowers paid more than they expected. The gap is not about lender type. It is about what the borrower verified before the process started.
Read More
Two proportional circles showing small manufacturing acquisition activity rising 22 percent from Q4 2025 to Q1 2026, with a caption that equipment, inventory, and receivables all need financing, not just the purchase.

Manufacturing Acquisitions Are Back. Financing Them Like a Cash-Flow Buyout Isn't.

Manufacturing acquisitions jumped 22% in Q1 2026, but buyers financing them with a single acquisition loan leave equipment, inventory, and working capital unfunded. Why asset-heavy deals need a blended capital stack.
Read More
Anatomy diagram showing an illiquid asset retained by its owner, a facility structured against it, and liquidity released while ownership and future upside are kept.

Selling the Asset Is the Most Expensive Way to Raise Cash

Selling an illiquid asset to raise cash costs twice, in discount and in forfeited upside. How owners unlock liquidity by borrowing against the asset instead of selling it.
Read More
Single stacked bar showing a $4.0 million carrier facility split into a $2.6 million equipment term tranche for 12 tractor-trailer units and a $1.4 million ABL revolver.

How One Regional Carrier Financed Fleet Expansion Into a Record Market After the Bank Said No

US truckload spot rates hit a record $3.83 per mile, but recession-scarred balance sheets stall bank-only expansion. How one carrier structured $4.0M to add trucks in days.
Read More
Two-point range chart showing a data-infrastructure refresh rising from a $4.0M prior-cycle budget to a $6.0M current quote, a 50 percent increase driven by 2026 memory price inflation.

The Same Server Refresh Now Costs 50% More: How One Operator Funded It Without Draining the Business

Memory prices doubled in 2026, pushing a $4M server refresh to $6M. How structuring the financing, not paying cash, preserves the liquidity that runs the business.
Read More
Single stacked bar. how a blended borrowing base is built, against the cash-flow line offered.

Asset-Rich, Credit-Capped: Why Tightening Operators Borrow Against the Wrong Thing

Asset-rich operators tightening through rising costs often borrow against the wrong thing. Why a cash-flow line caps capacity the balance sheet could exceed, with the numbers.
Read More
Trend line showing the share of physicians in wholly physician-owned private practices falling from 60.1% in 2012 to 46.7% in 2022 and 42.2% in 2024, per the AMA Physician Practice Benchmark Survey, an 18-point decline.

Leasing or Buying the Equipment Is a Liquidity Decision. In 2026 the Wrong Default Costs More Than the Rate.

Physician-owned practice share fell 18 points from 2012 to 2024. Here is why equipment financing structure, not rate, is the liquidity decision that keeps a medical practice independent.
Read More
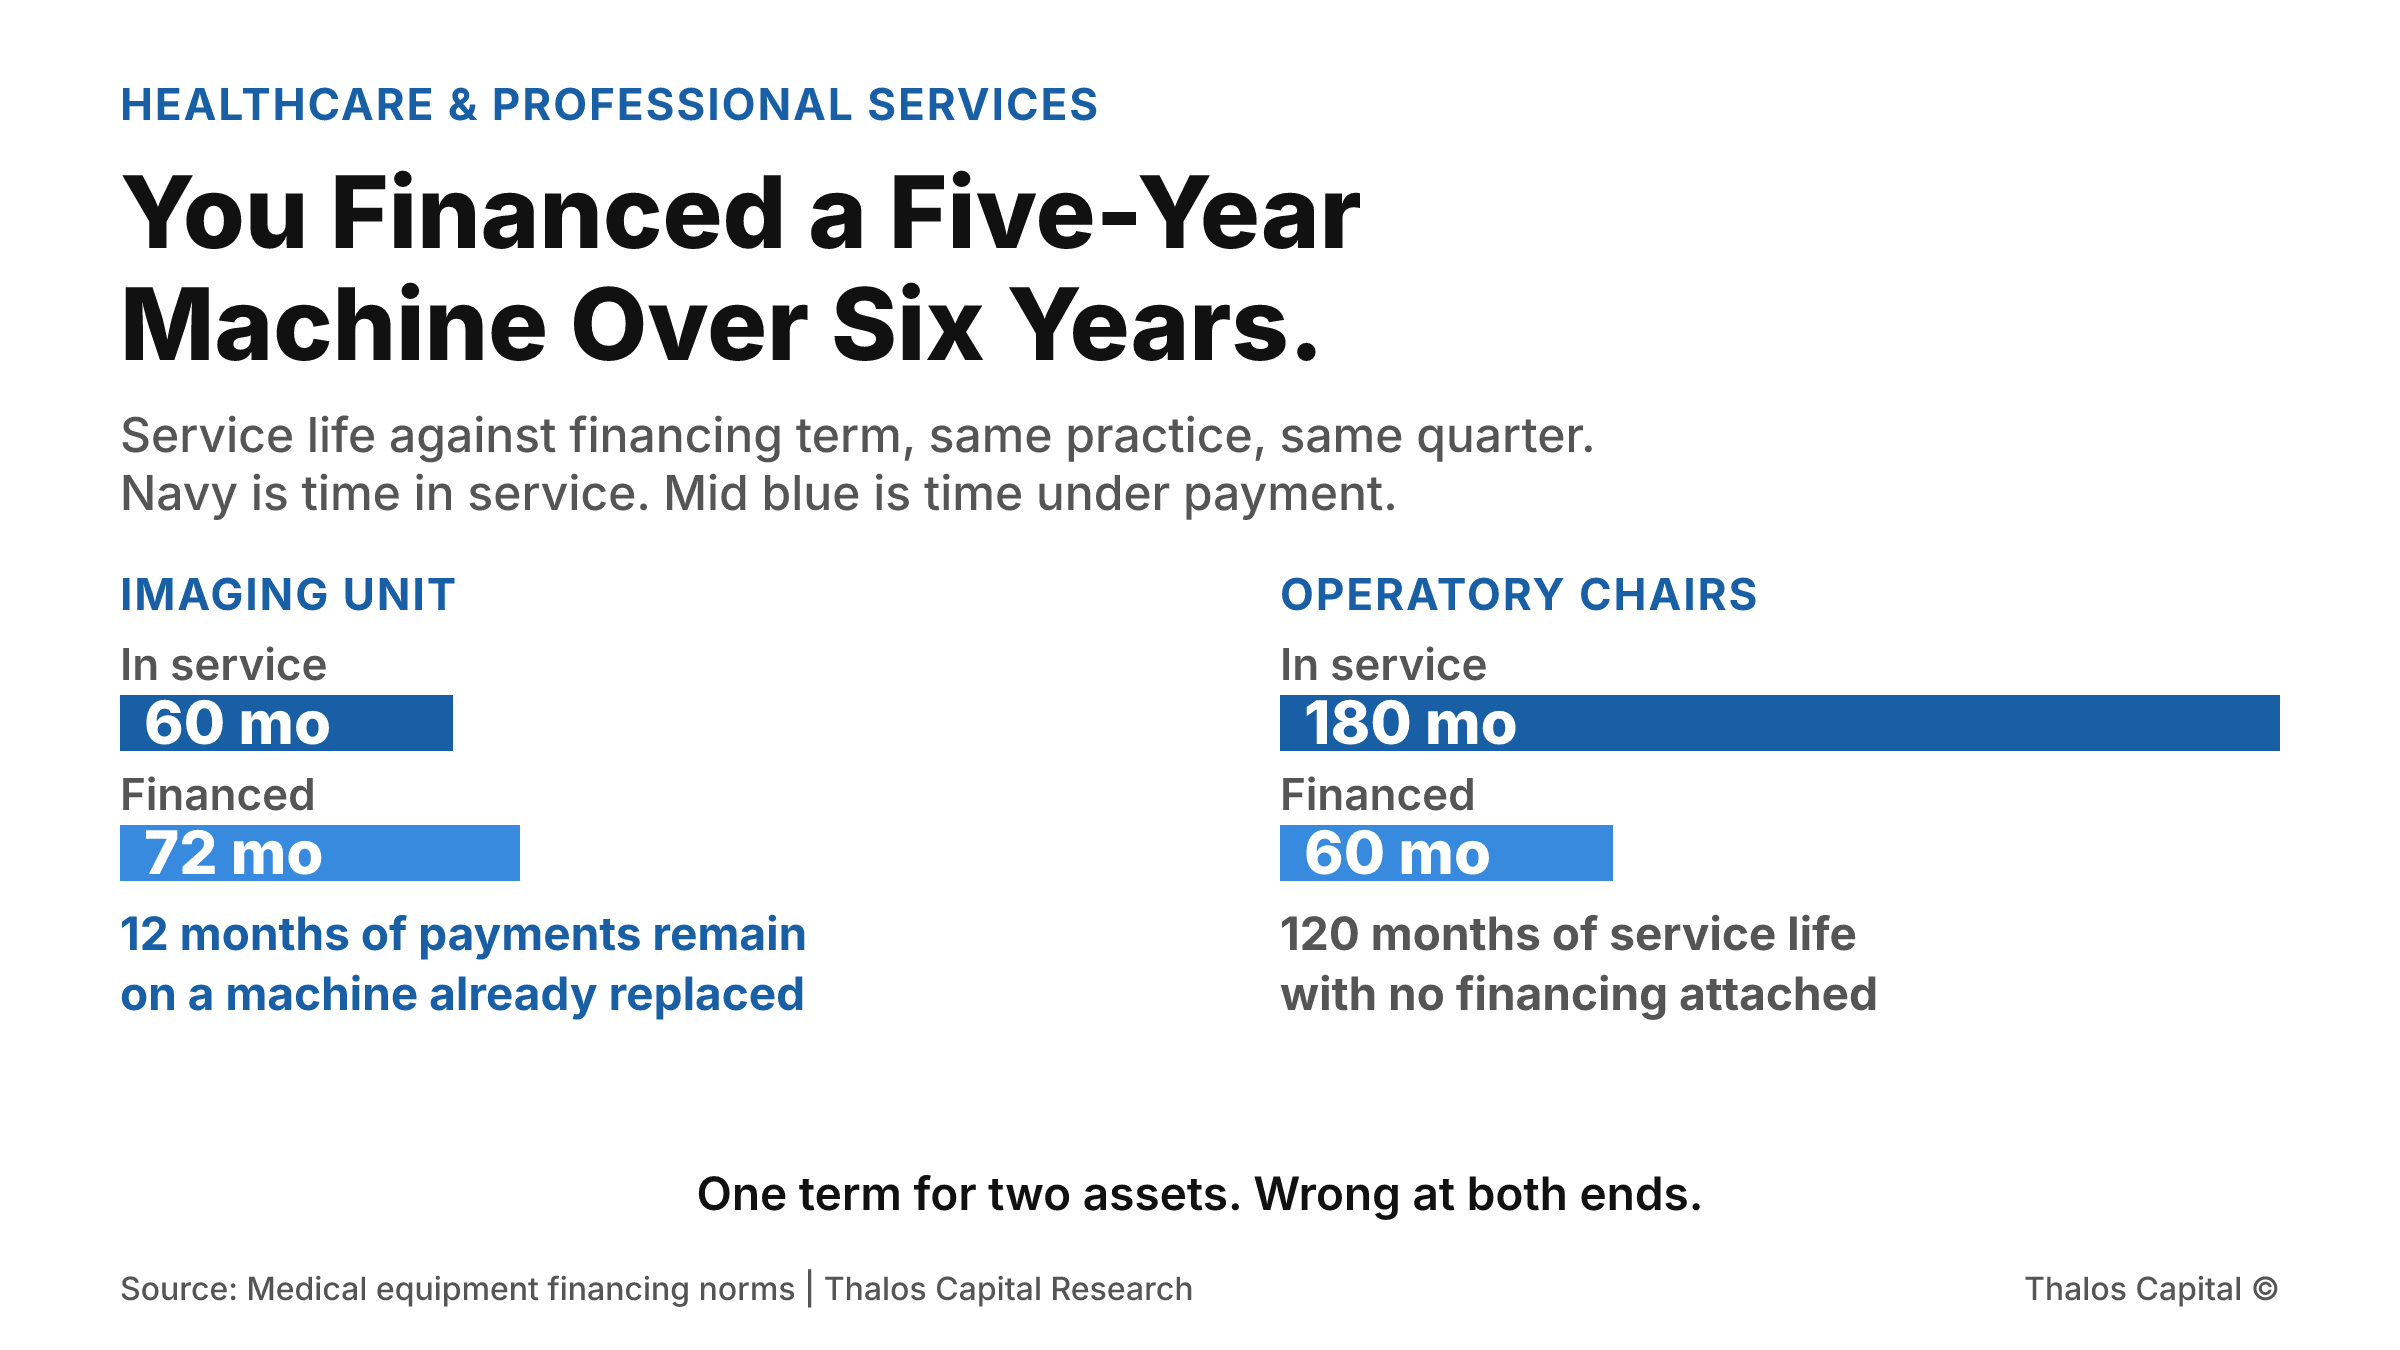
Two-point range comparing two offers for the same business, showing an accepted bid with committed financing that closed and a competing bid roughly 8 percent higher with a financing contingency that did not close.

Same Business, Two Offers: Why the Lower Bid Won

A higher bid lost to a lower one backed by committed financing. In 2026's busy M&A market, structure and certainty of close decide which acquisition offer a seller actually takes.
Read More
Bar chart showing 42 percent of small business financing applicants received the full amount, 36 percent some or most, 22 percent none.

Getting Approved Is Not Getting Funded: The 42% Problem

Only 42% of small businesses get the full financing they request. Why partial approval is the most expensive outcome, and what fully funded borrowers do differently.
Read More
Bar chart of May 2026 Logistics Managers Index transportation readings showing prices at 96.0, utilization at 69.5, and capacity at 31.7, with prices expanding at a record pace while capacity contracts.

Freight Rates Just Hit a Record. The Carriers Without Capital Will Watch It Pass.

Truckload spot rates hit a record near $3.83 a mile while capacity contracts and a federal crackdown pulls trucks off the road. Why carriers need equipment and working capital financing to capture the window.
Read More
Bar chart of May 2026 ISM manufacturing readings showing the PMI at 54.0, New Orders at 56.8, and the Prices Index at 82.1, with demand expanding while input prices stay elevated.

The Order Came In. The Cash to Fill It Did Not.

Manufacturing demand hit a multi-year high in May while input prices stayed near record levels. Why funding capacity now depends on how equipment and working capital financing is structured and sourced.
Read More
Working through a financing decision?
Insights are a starting point. A conversation maps your actual options.
Tell us what you are financing and we will map the structures and sources that fit.
Submit your financing request →
Explore our financing solutions
Equipment FinancingWorking CapitalAsset-Based LendingStrategic Debt