Category

Business Case & ROI

24 insights · page 3 of 3

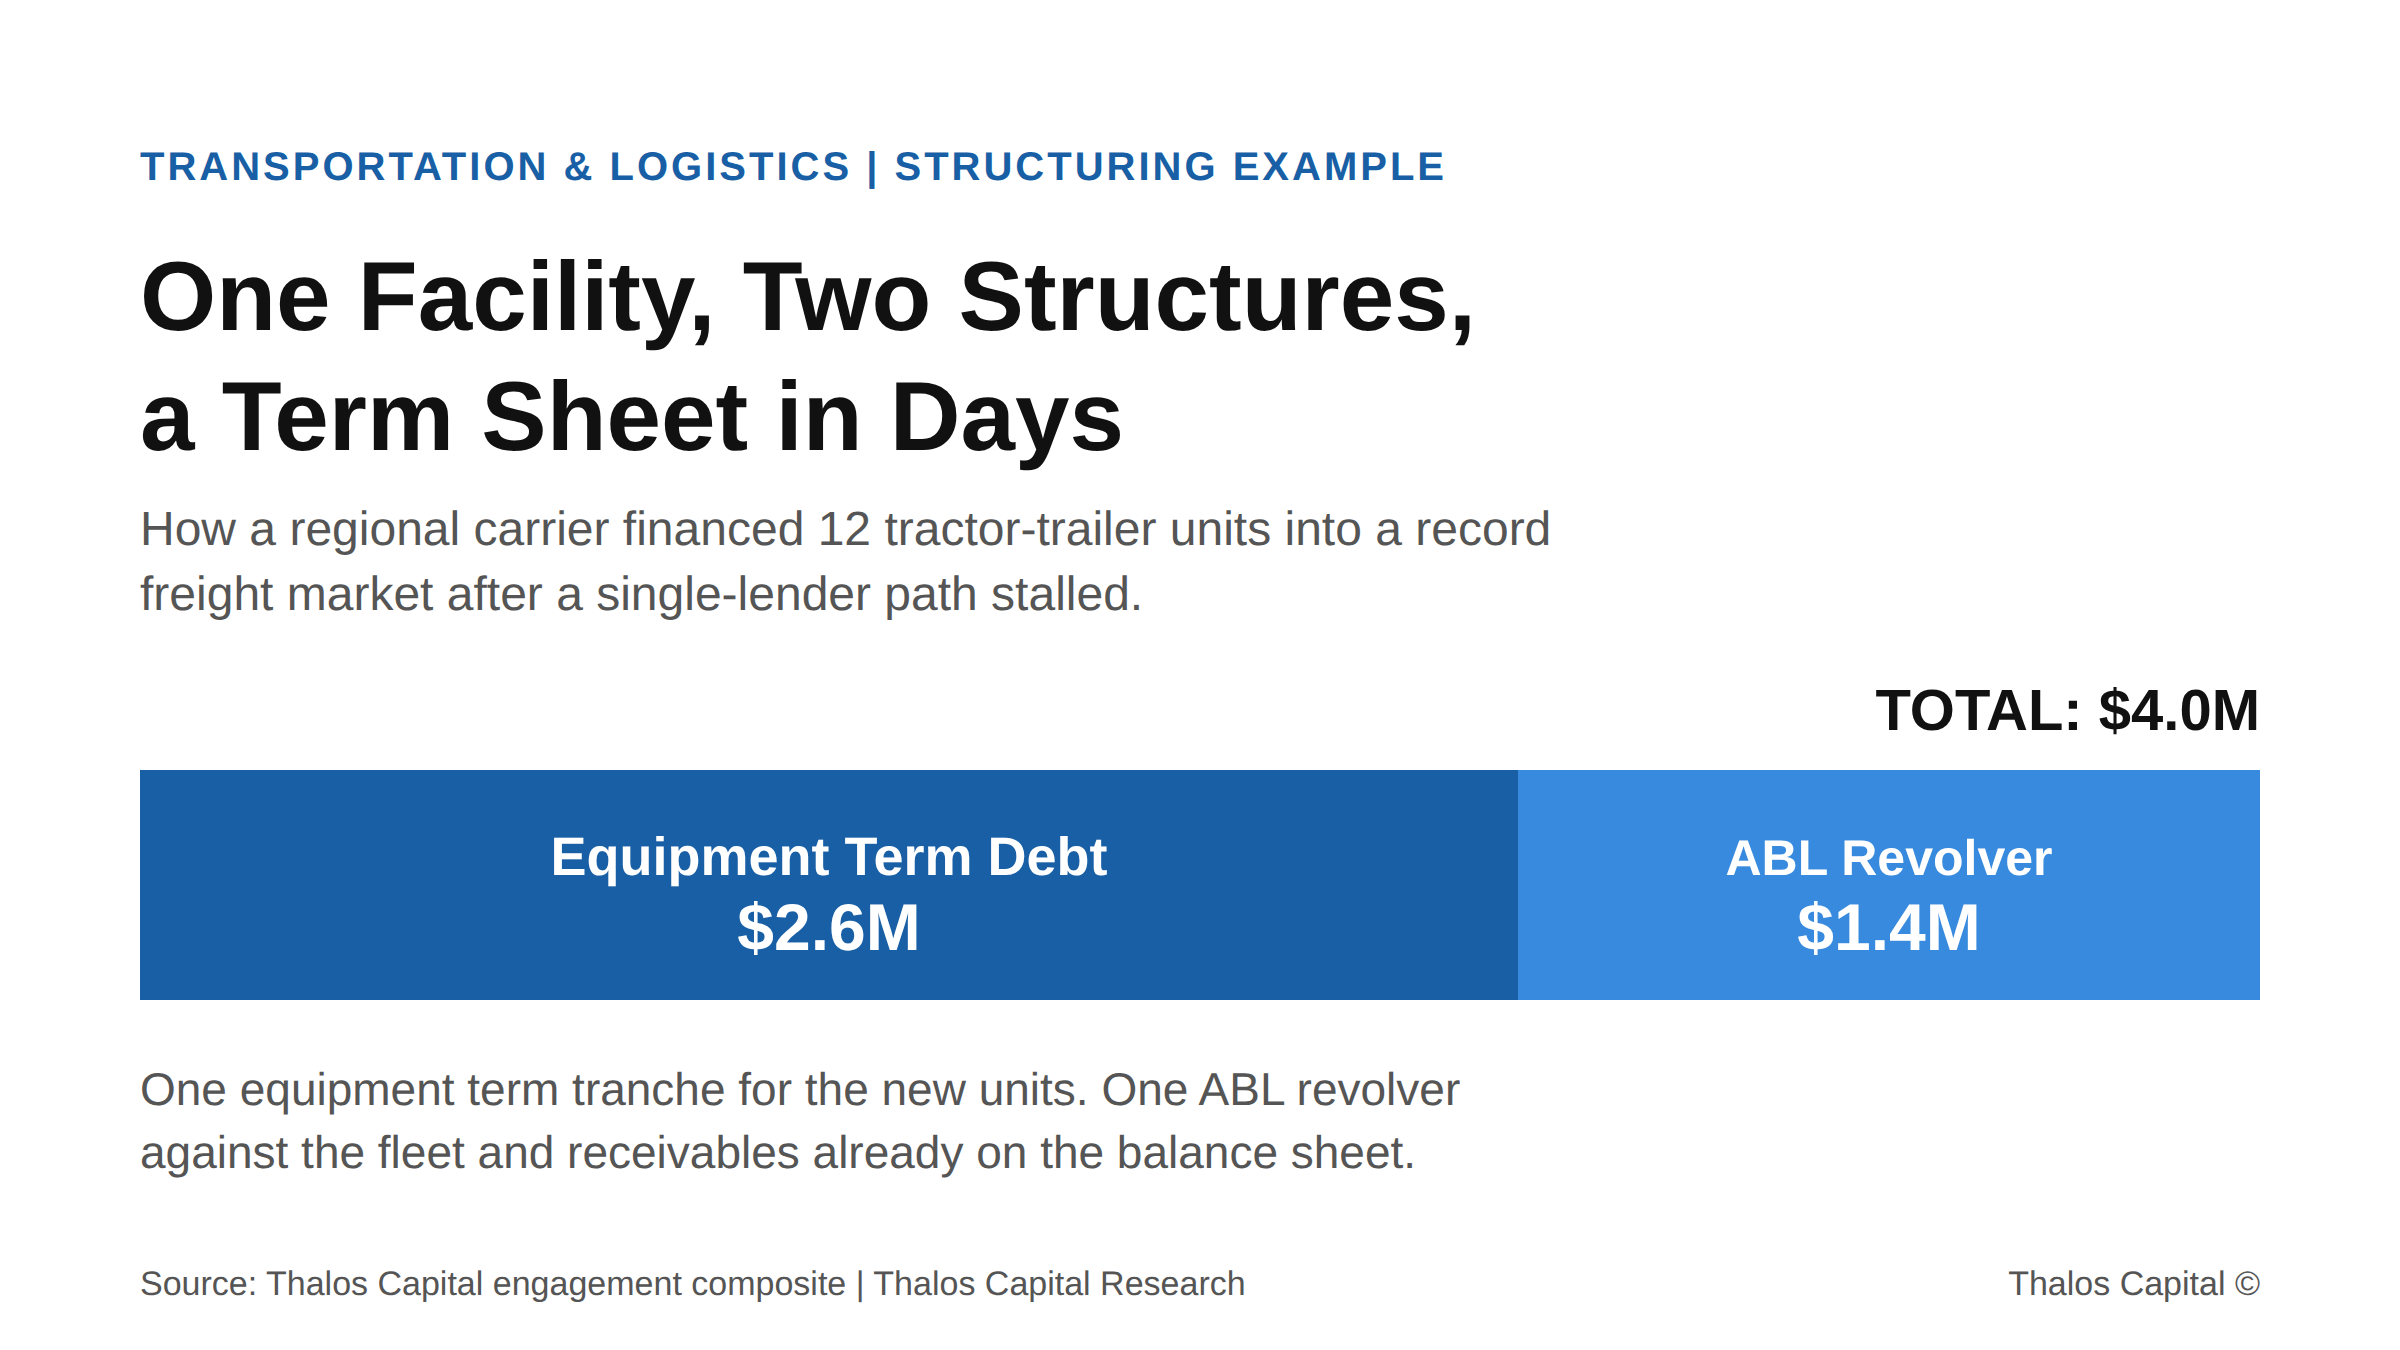
Single stacked bar showing a $4.0 million carrier facility split into a $2.6 million equipment term tranche for 12 tractor-trailer units and a $1.4 million ABL revolver.

How One Regional Carrier Financed Fleet Expansion Into a Record Market After the Bank Said No

US truckload spot rates hit a record $3.83 per mile, but recession-scarred balance sheets stall bank-only expansion. How one carrier structured $4.0M to add trucks in days.
Read More
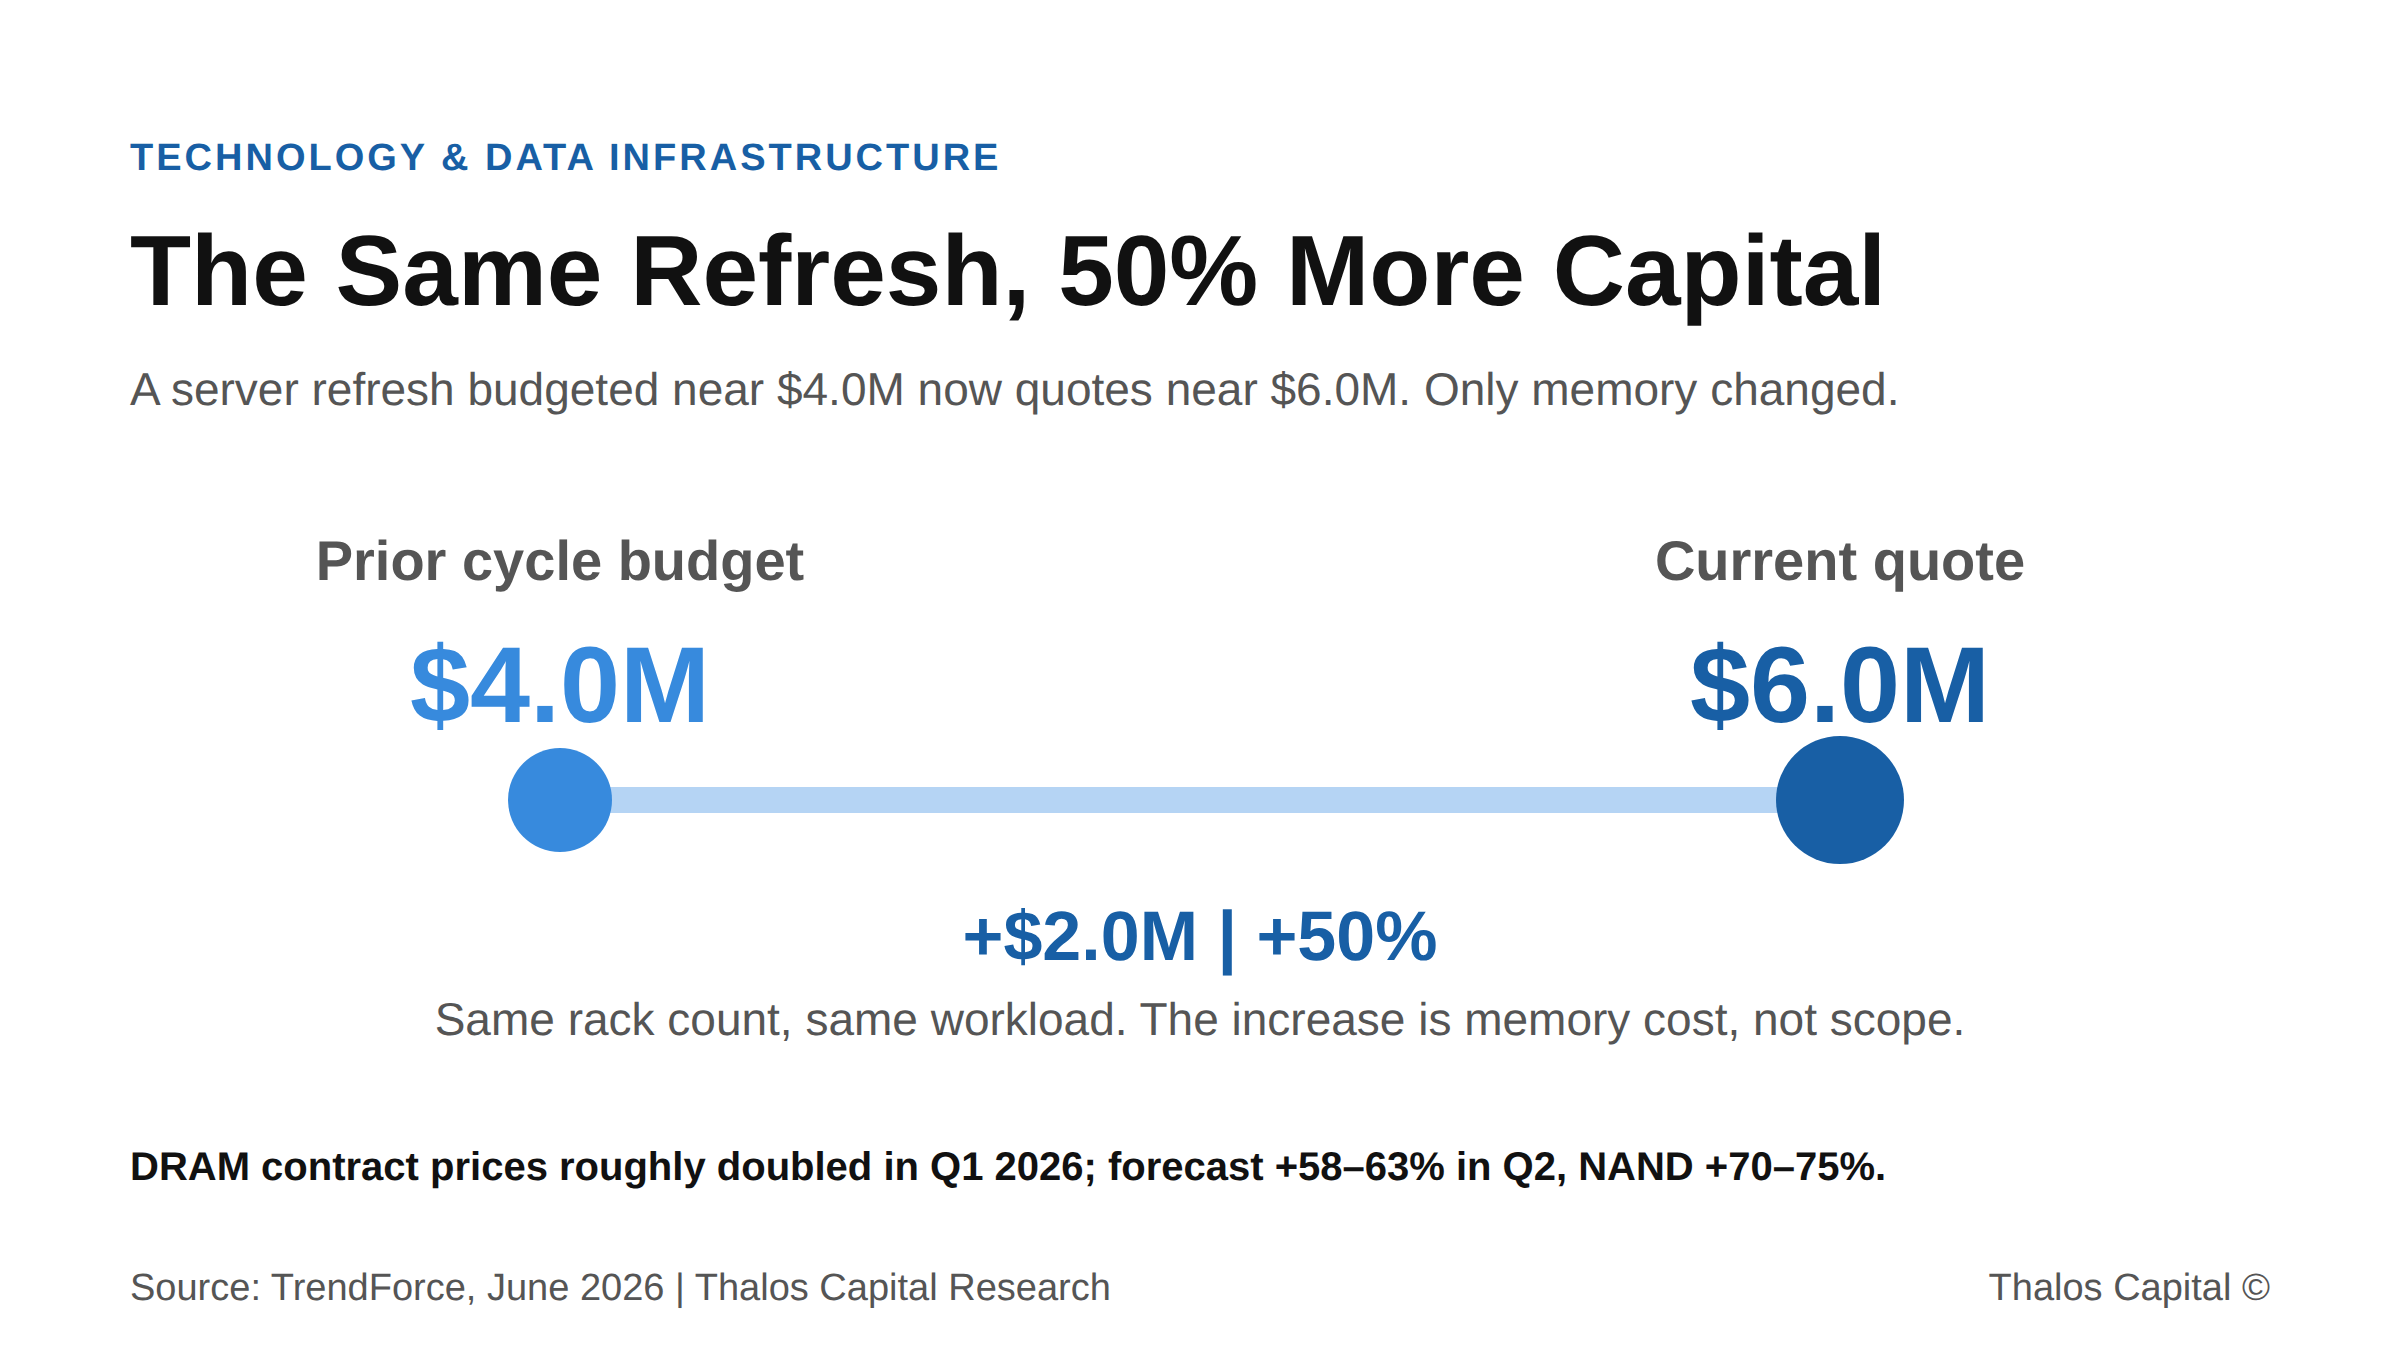
Two-point range chart showing a data-infrastructure refresh rising from a $4.0M prior-cycle budget to a $6.0M current quote, a 50 percent increase driven by 2026 memory price inflation.

The Same Server Refresh Now Costs 50% More: How One Operator Funded It Without Draining the Business

Memory prices doubled in 2026, pushing a $4M server refresh to $6M. How structuring the financing, not paying cash, preserves the liquidity that runs the business.
Read More
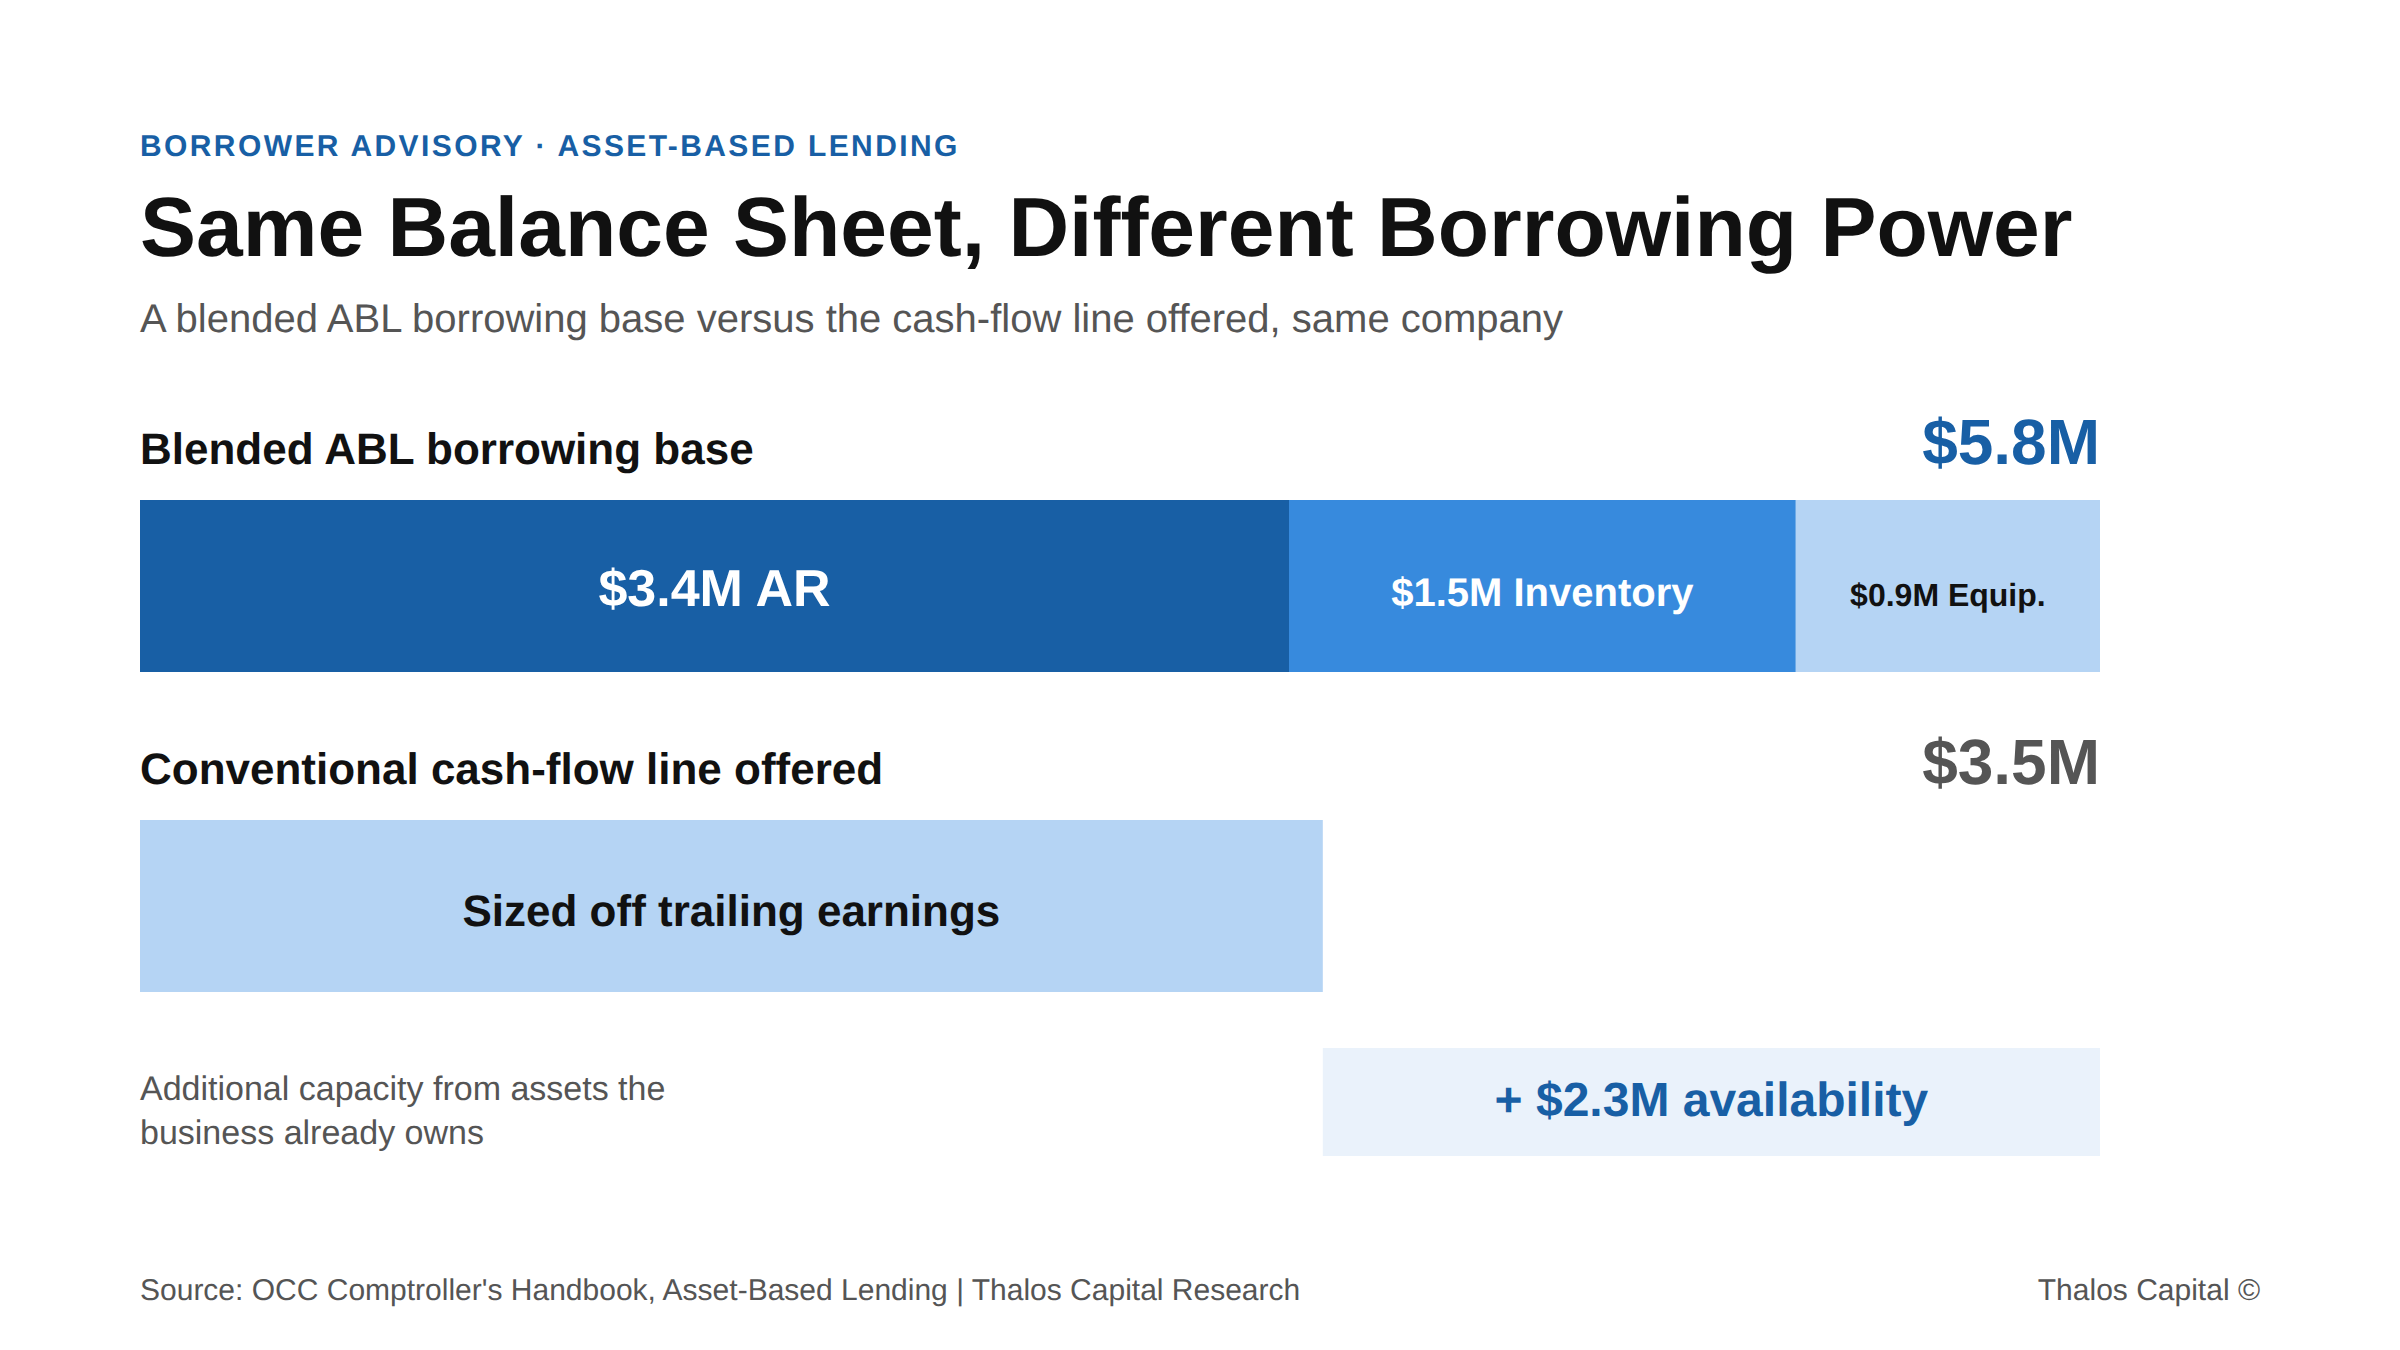
Single stacked bar. how a blended borrowing base is built, against the cash-flow line offered.

Asset-Rich, Credit-Capped: Why Tightening Operators Borrow Against the Wrong Thing

Asset-rich operators tightening through rising costs often borrow against the wrong thing. Why a cash-flow line caps capacity the balance sheet could exceed, with the numbers.
Read More
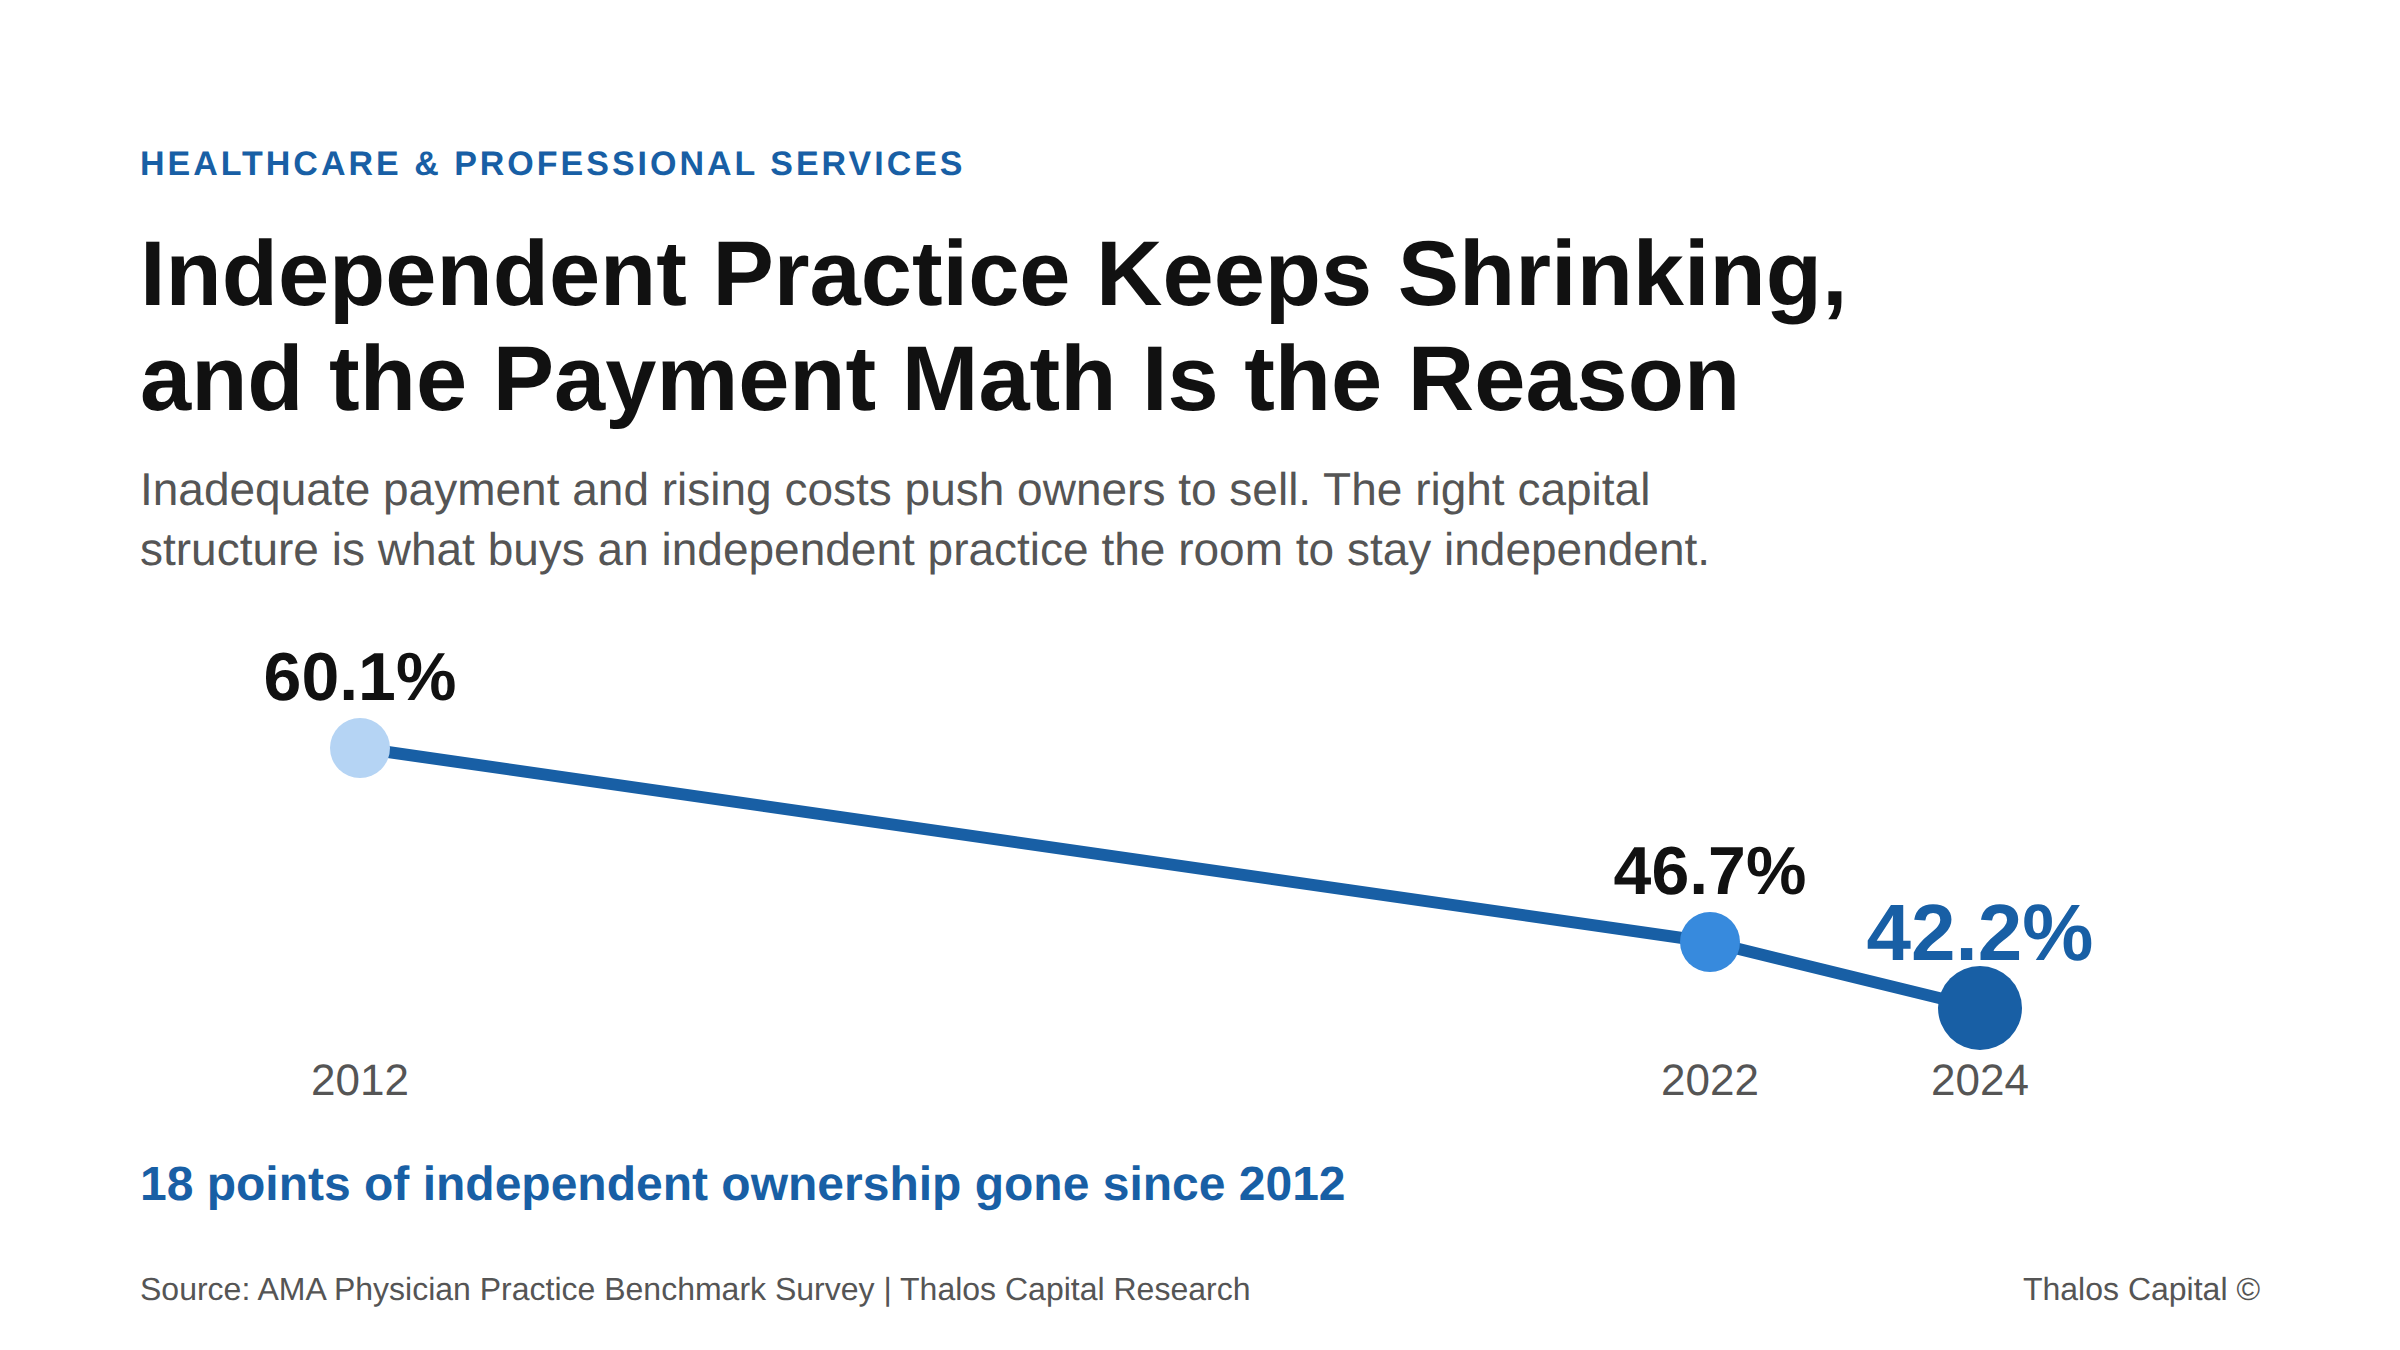
Trend line showing the share of physicians in wholly physician-owned private practices falling from 60.1% in 2012 to 46.7% in 2022 and 42.2% in 2024, per the AMA Physician Practice Benchmark Survey, an 18-point decline.

Leasing or Buying the Equipment Is a Liquidity Decision. In 2026 the Wrong Default Costs More Than the Rate.

Physician-owned practice share fell 18 points from 2012 to 2024. Here is why equipment financing structure, not rate, is the liquidity decision that keeps a medical practice independent.
Read More
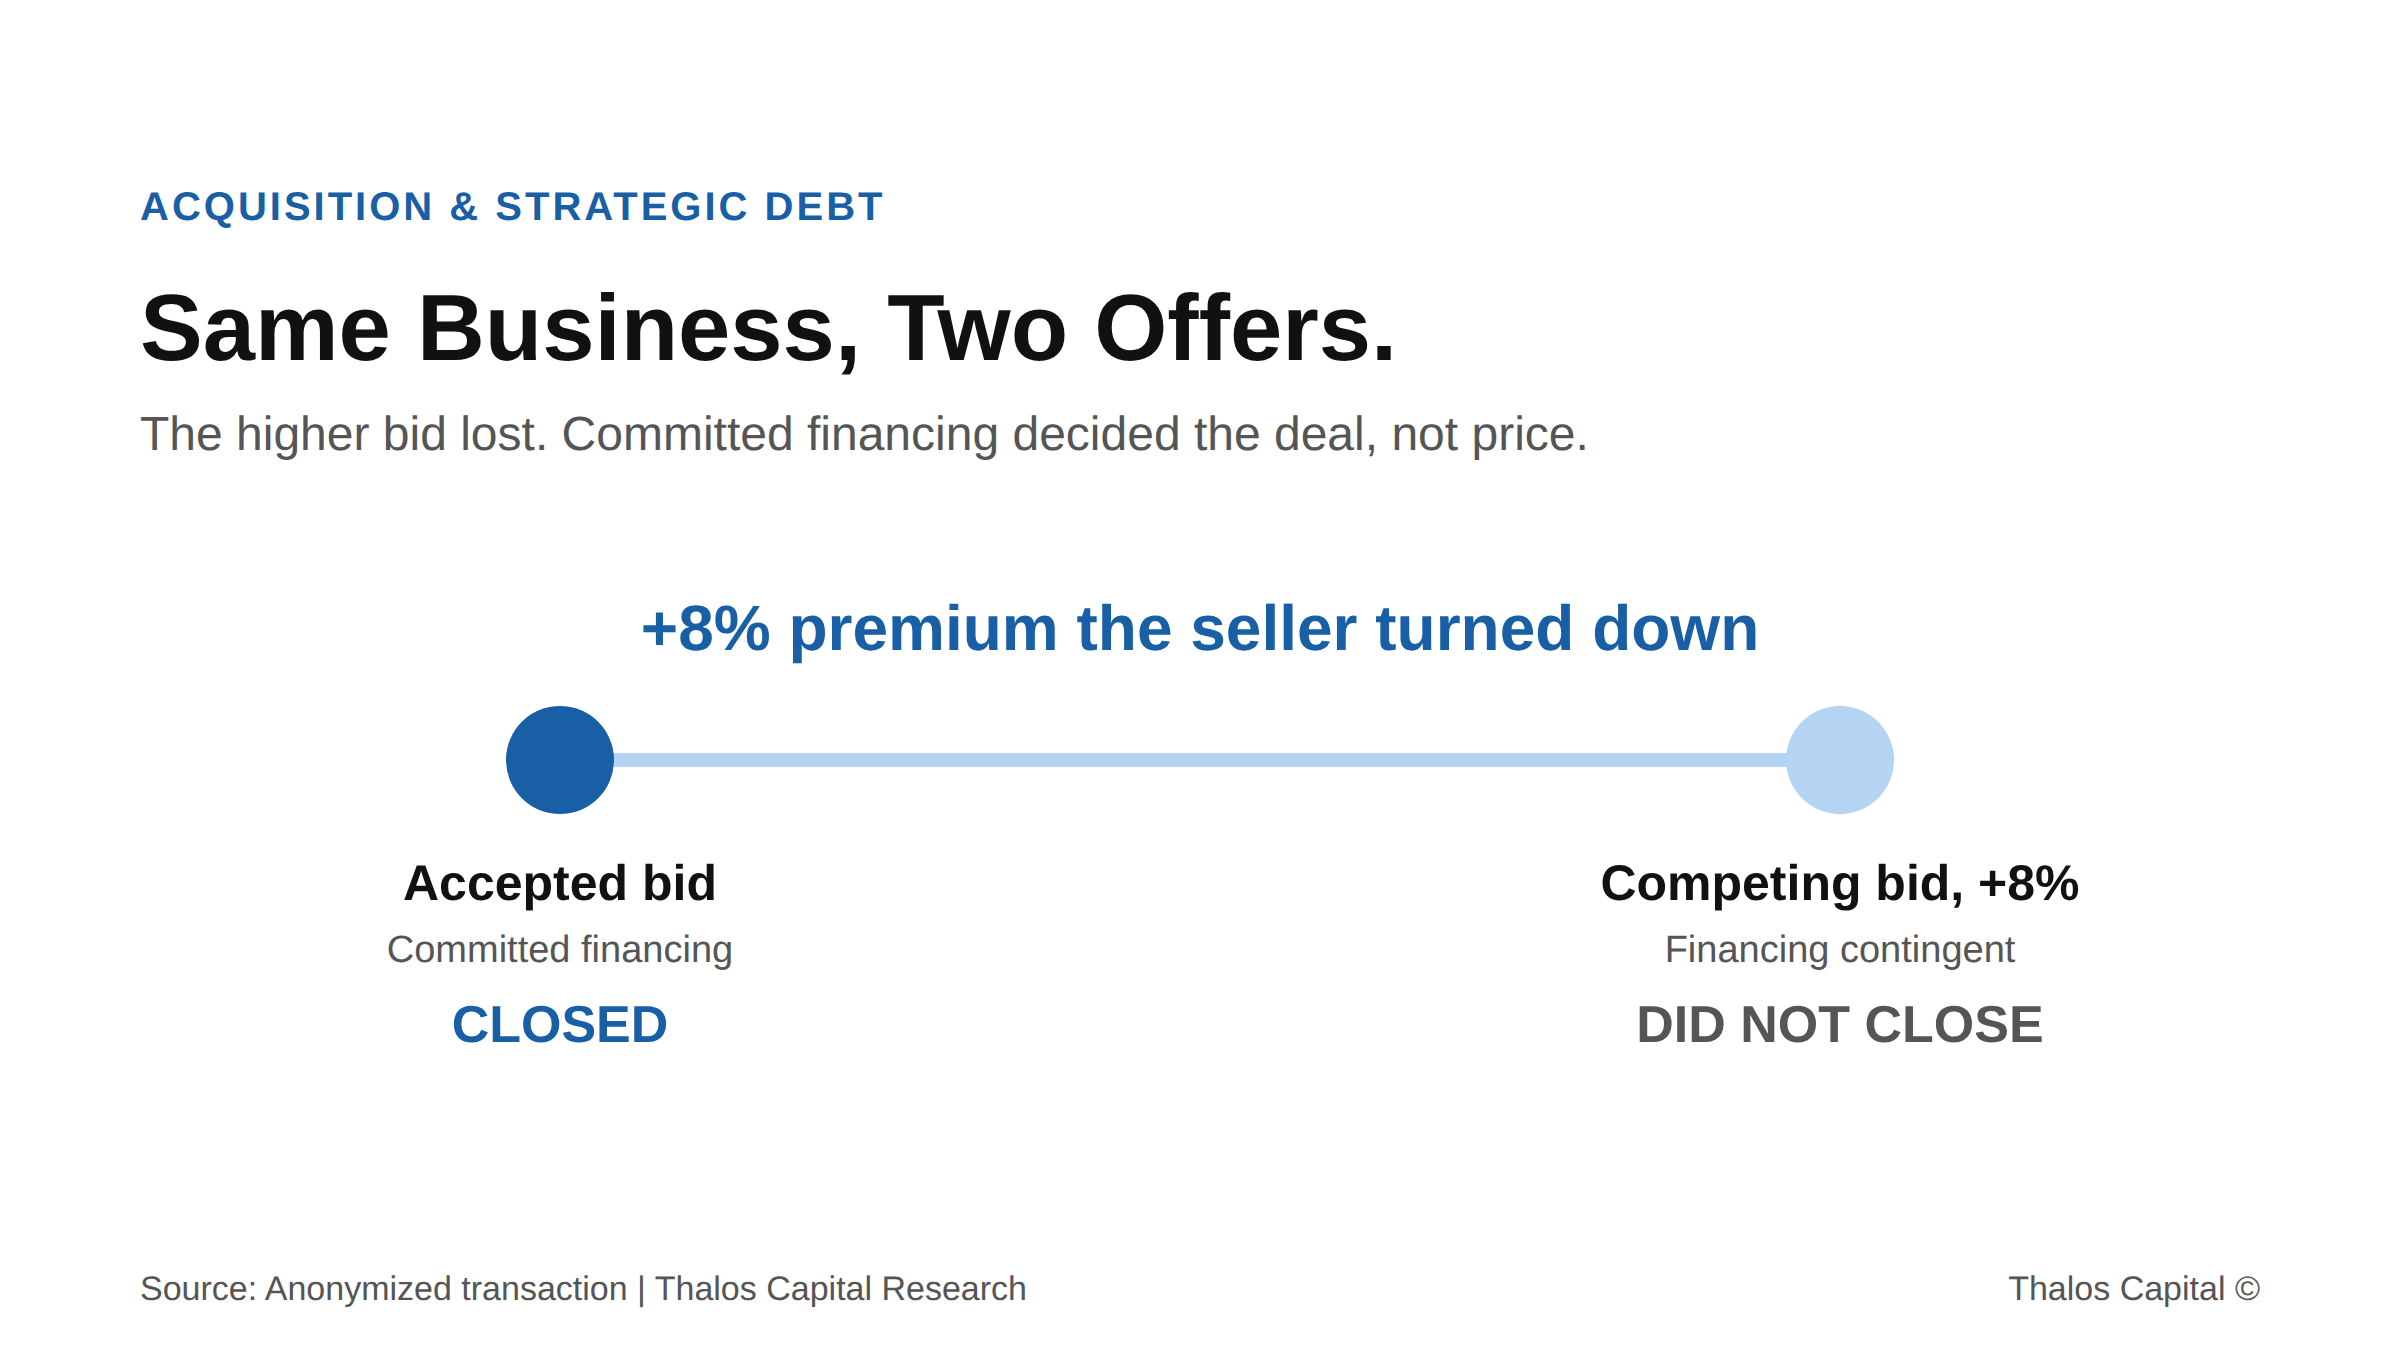
Two-point range comparing two offers for the same business, showing an accepted bid with committed financing that closed and a competing bid roughly 8 percent higher with a financing contingency that did not close.

Same Business, Two Offers: Why the Lower Bid Won

A higher bid lost to a lower one backed by committed financing. In 2026's busy M&A market, structure and certainty of close decide which acquisition offer a seller actually takes.
Read More
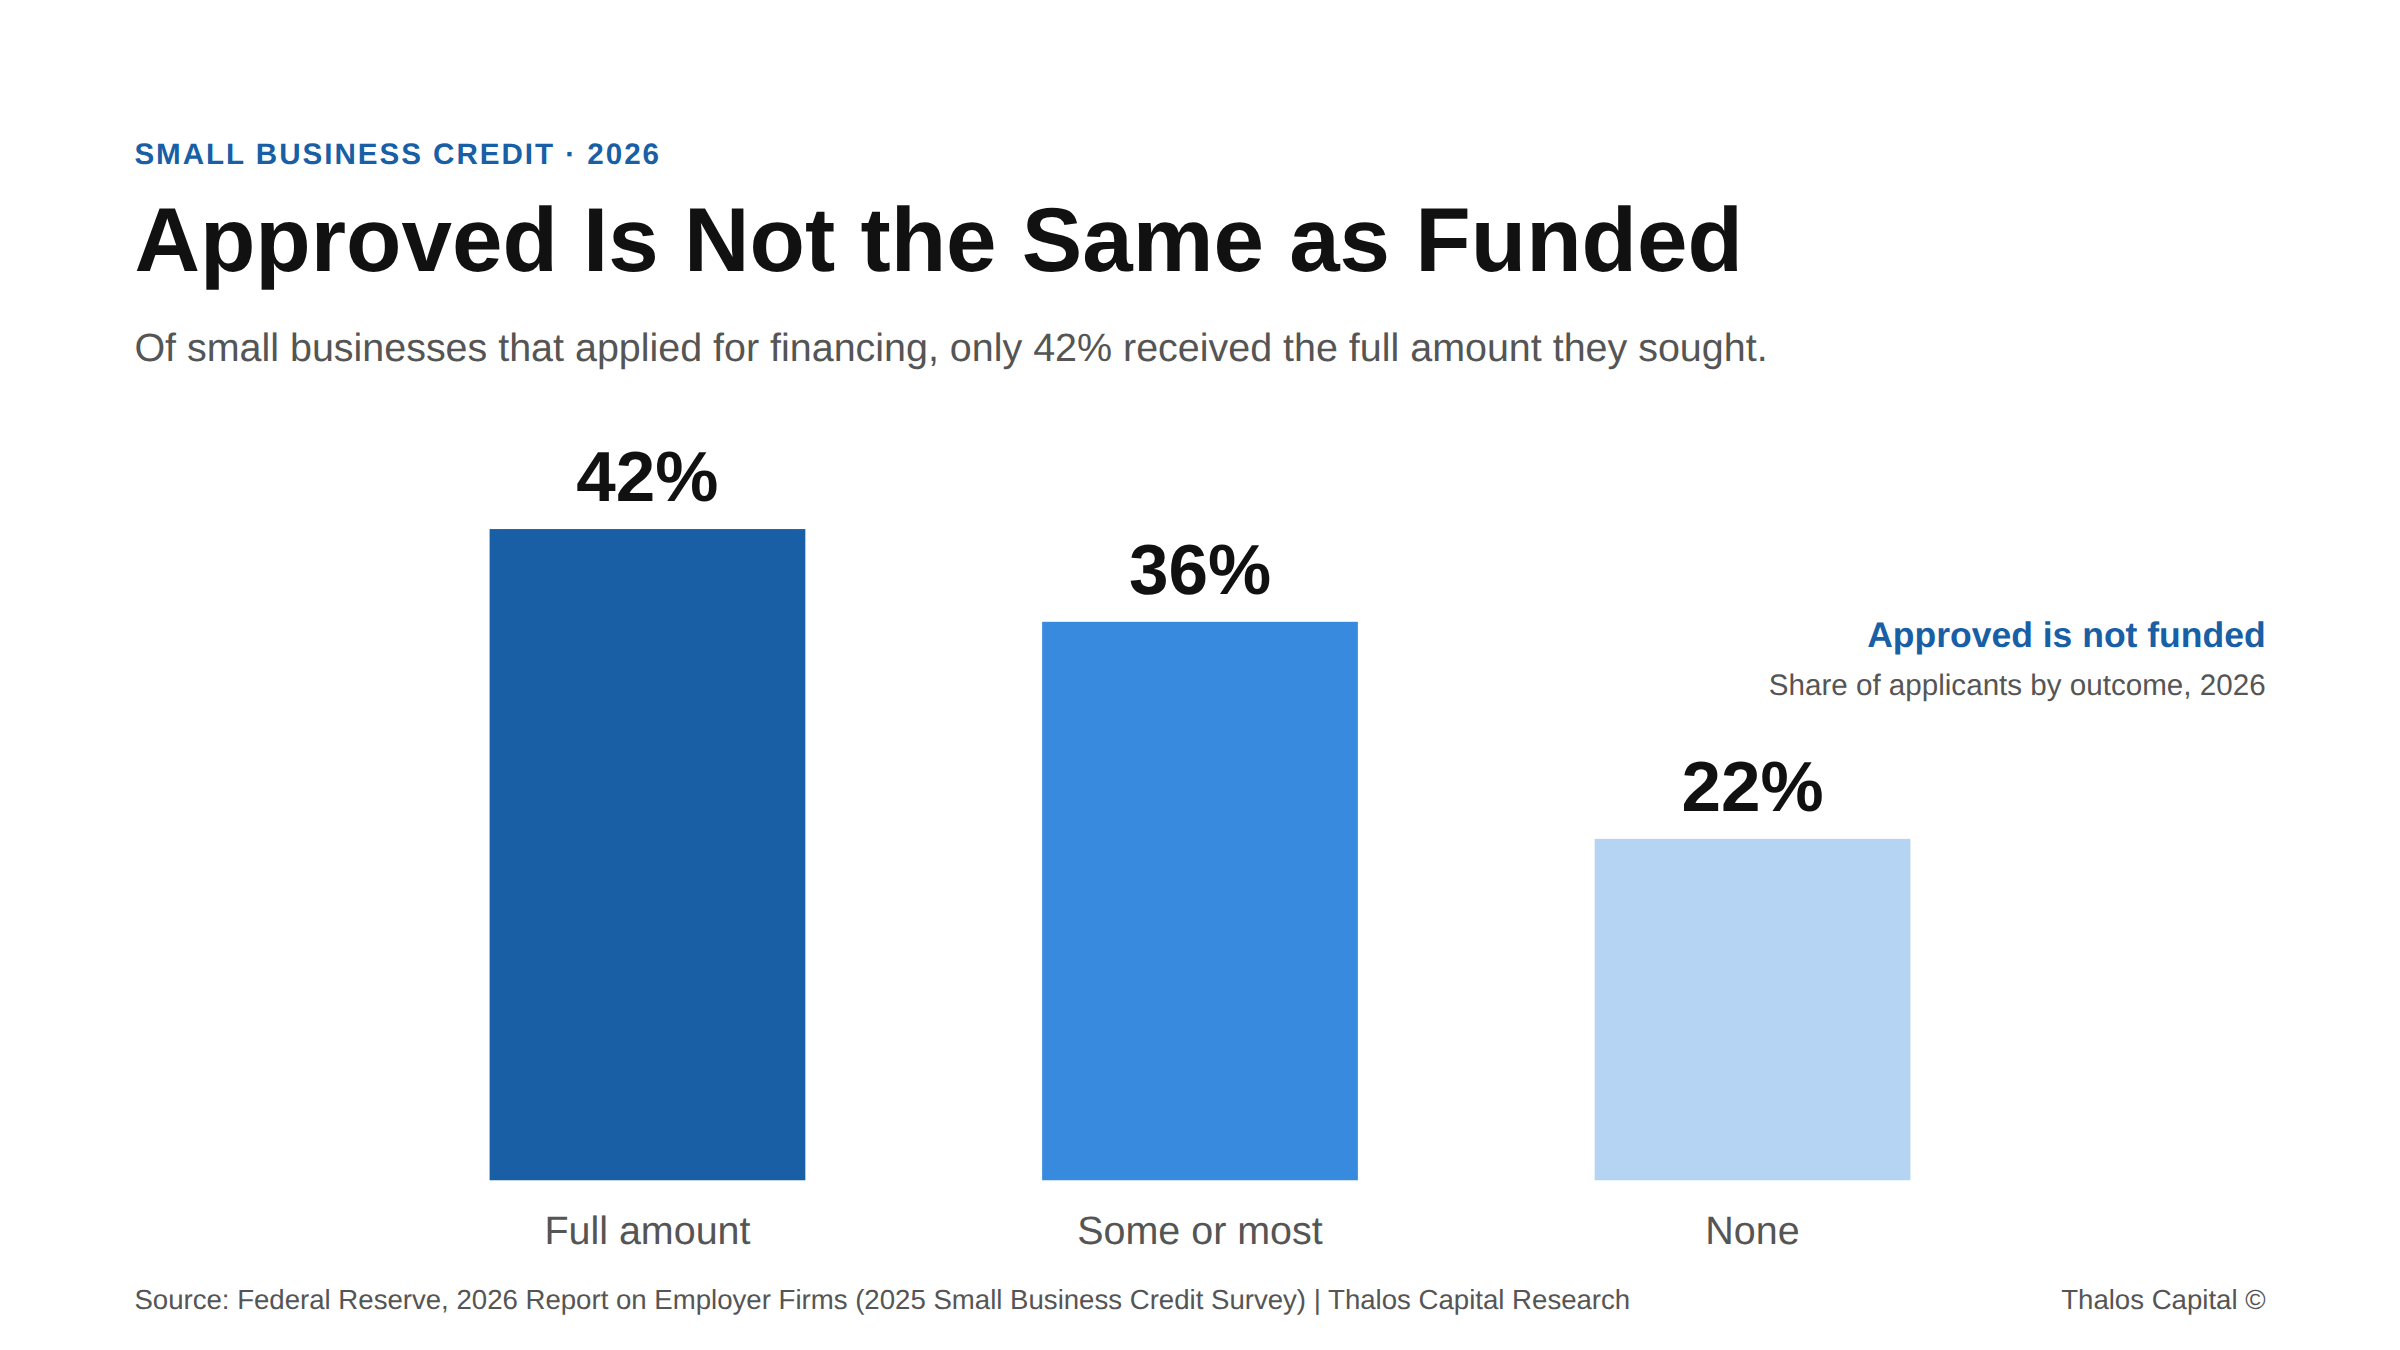
Bar chart showing 42 percent of small business financing applicants received the full amount, 36 percent some or most, 22 percent none.

Getting Approved Is Not Getting Funded: The 42% Problem

Only 42% of small businesses get the full financing they request. Why partial approval is the most expensive outcome, and what fully funded borrowers do differently.
Read More
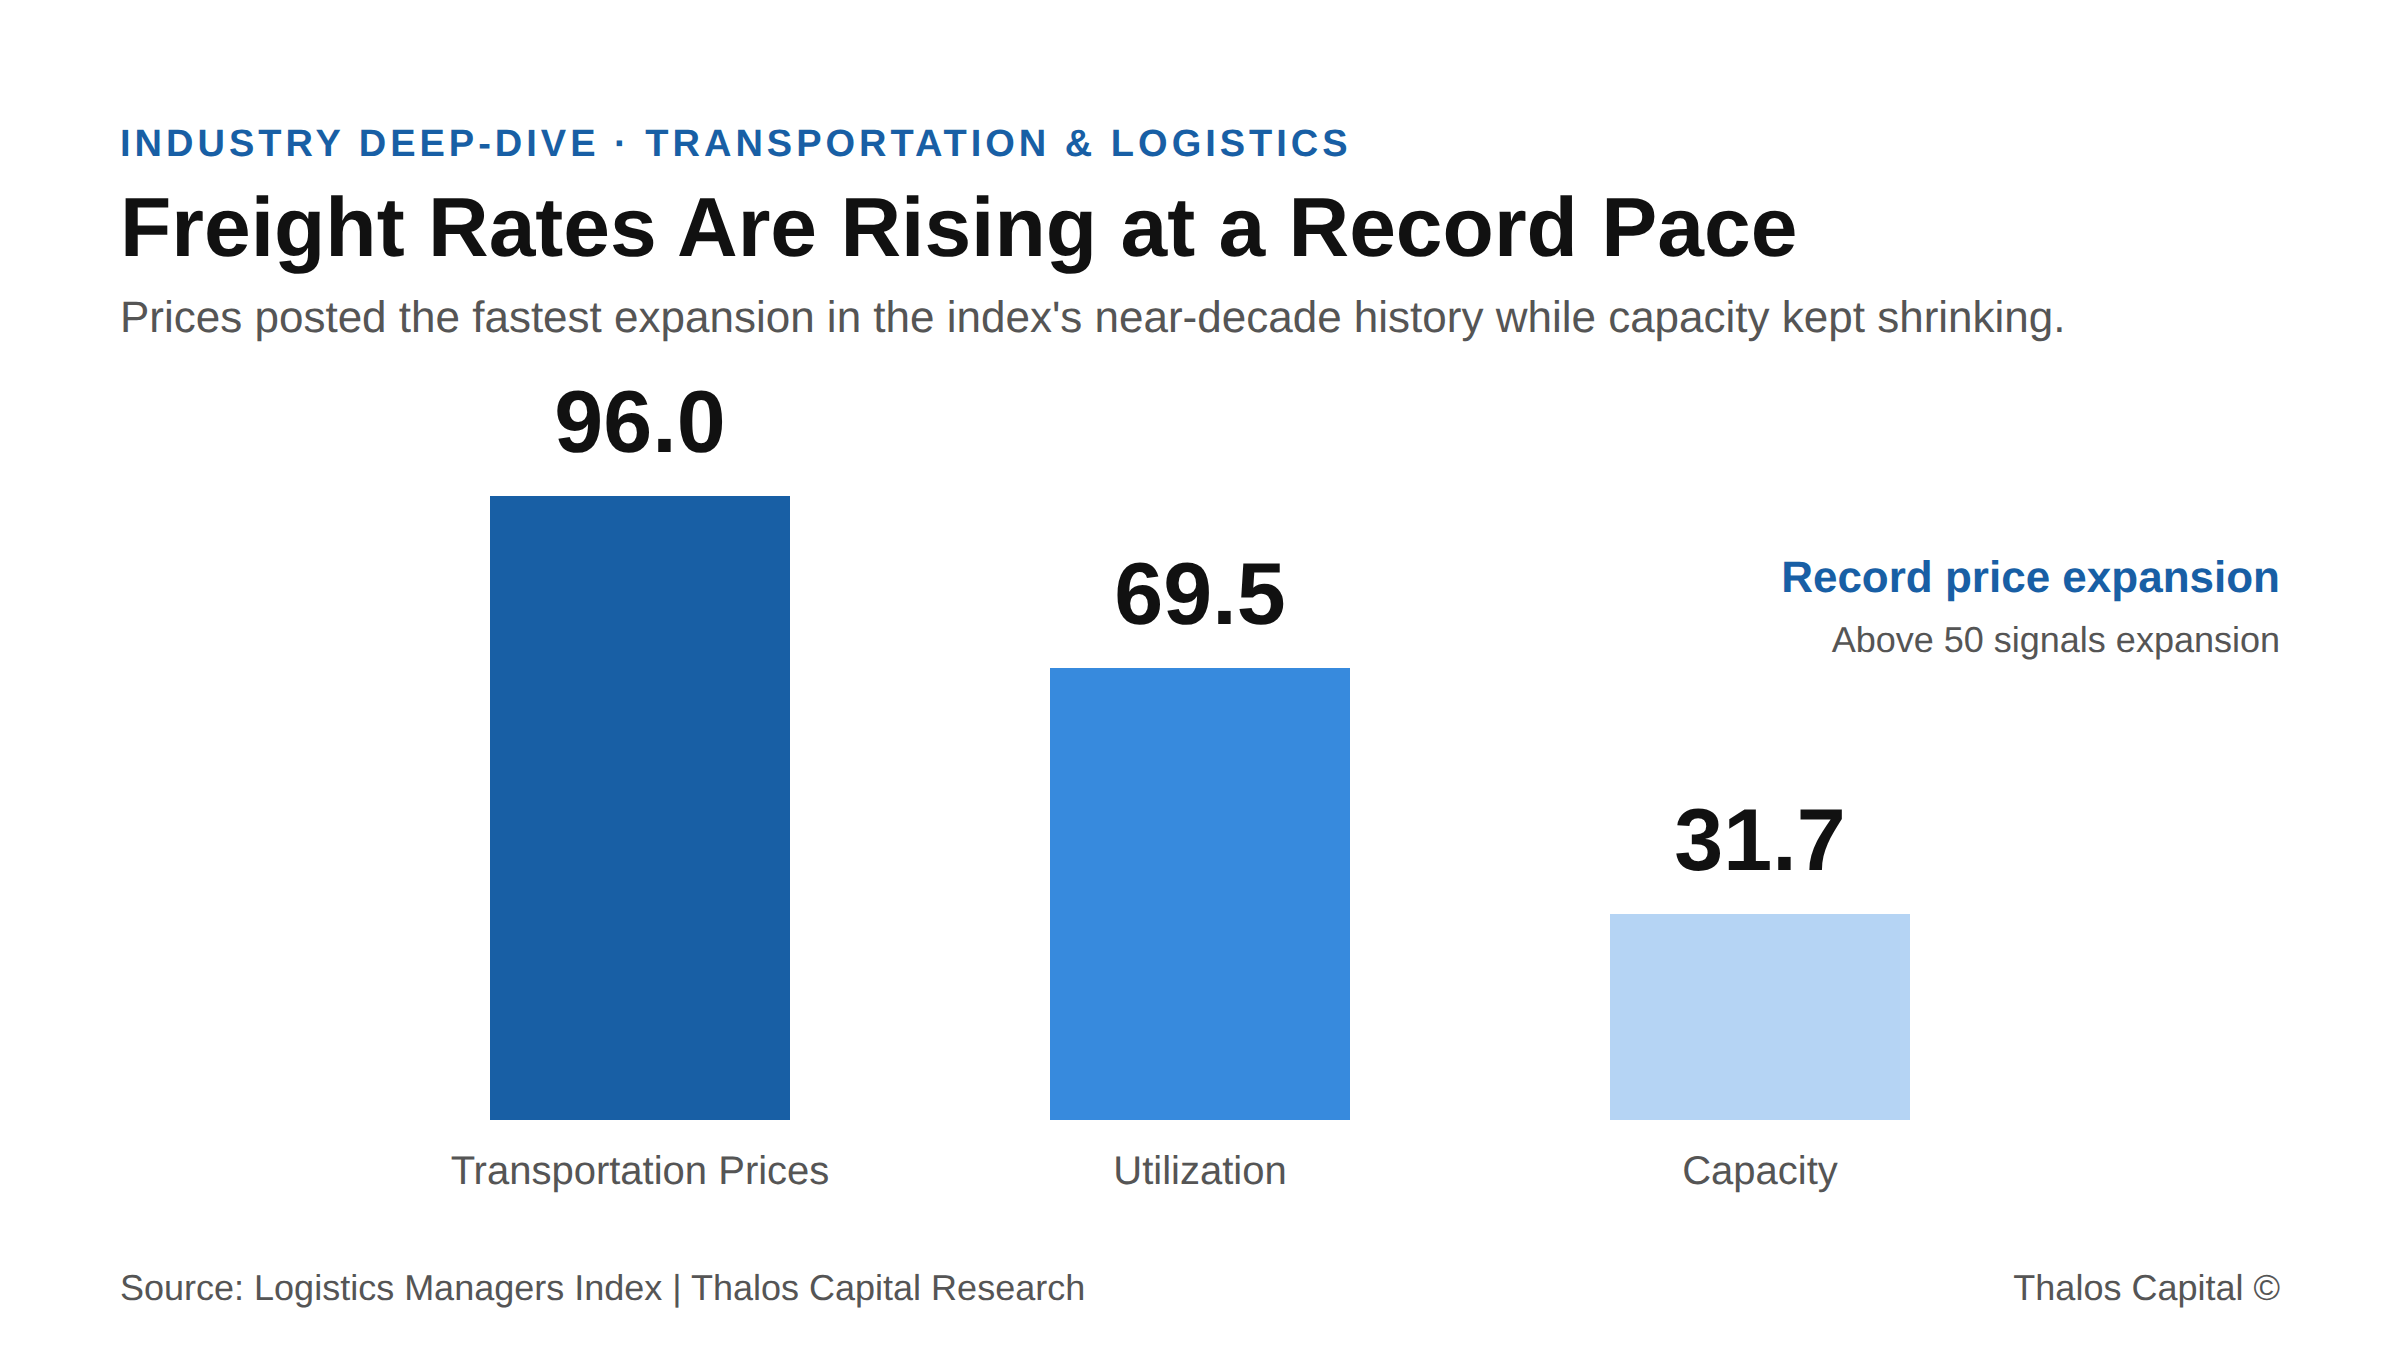
Bar chart of May 2026 Logistics Managers Index transportation readings showing prices at 96.0, utilization at 69.5, and capacity at 31.7, with prices expanding at a record pace while capacity contracts.

Freight Rates Just Hit a Record. The Carriers Without Capital Will Watch It Pass.

Truckload spot rates hit a record near $3.83 a mile while capacity contracts and a federal crackdown pulls trucks off the road. Why carriers need equipment and working capital financing to capture the window.
Read More
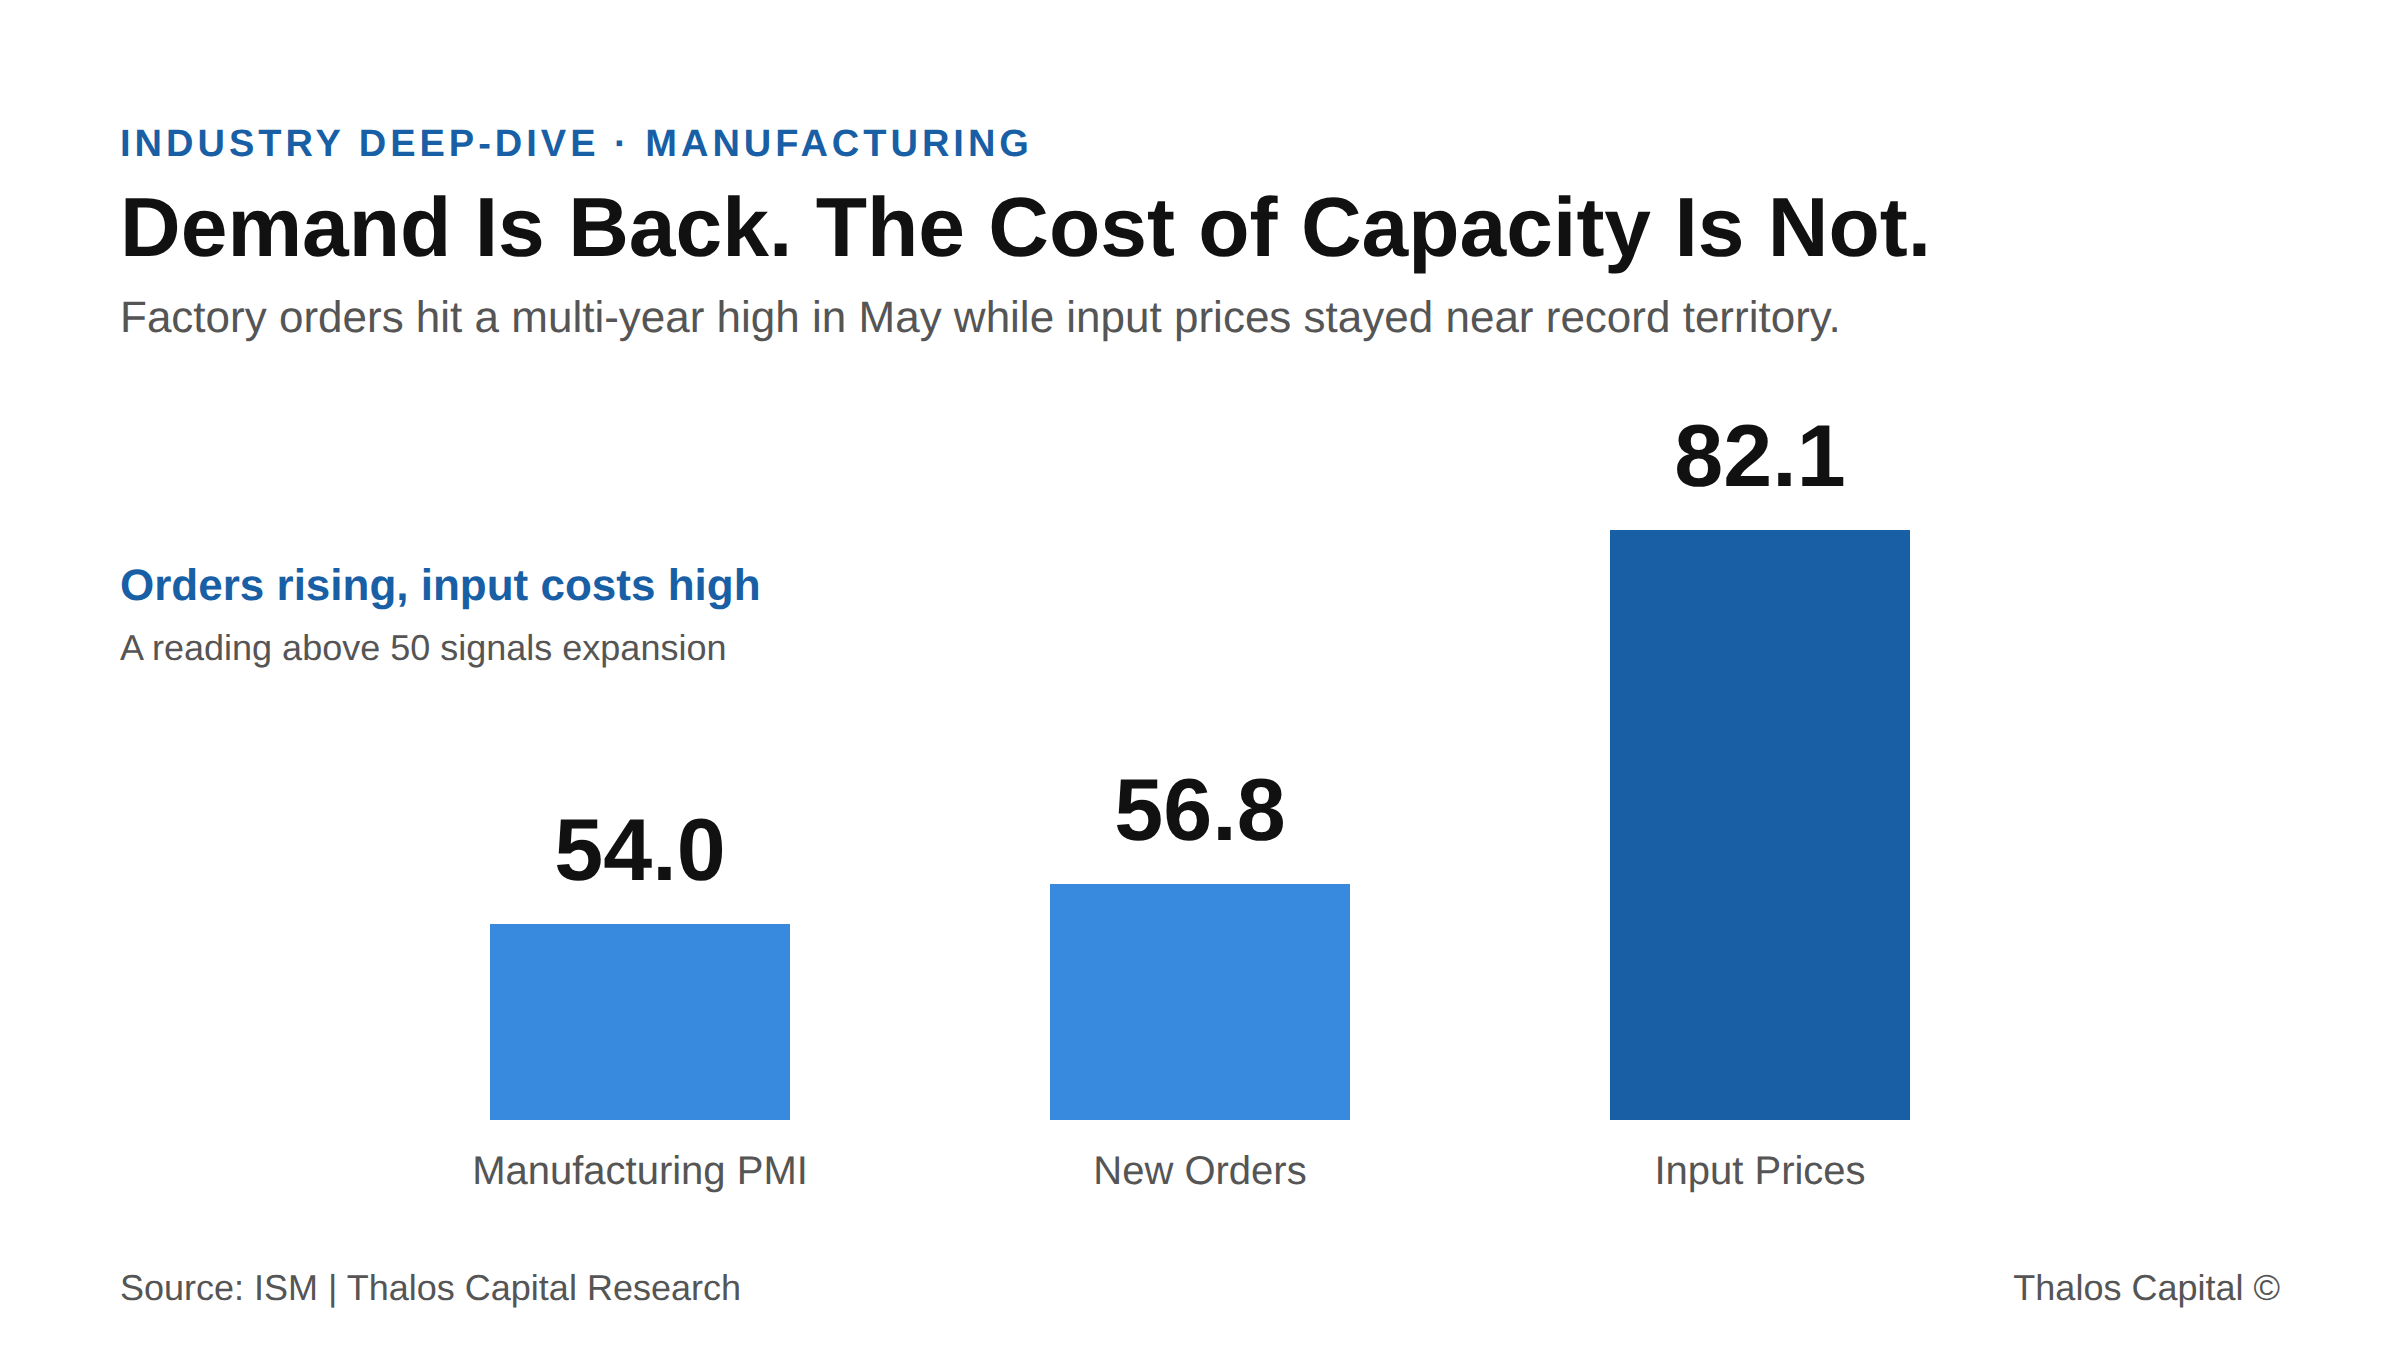
Bar chart of May 2026 ISM manufacturing readings showing the PMI at 54.0, New Orders at 56.8, and the Prices Index at 82.1, with demand expanding while input prices stay elevated.

The Order Came In. The Cash to Fill It Did Not.

Manufacturing demand hit a multi-year high in May while input prices stayed near record levels. Why funding capacity now depends on how equipment and working capital financing is structured and sourced.
Read More
Working through a financing decision?
Insights are a starting point. A conversation maps your actual options.
Tell us what you are financing and we will map the structures and sources that fit.
Submit your financing request →
Explore our financing solutions
Equipment FinancingWorking CapitalAsset-Based LendingStrategic Debt