Tag

working capital

7 insights

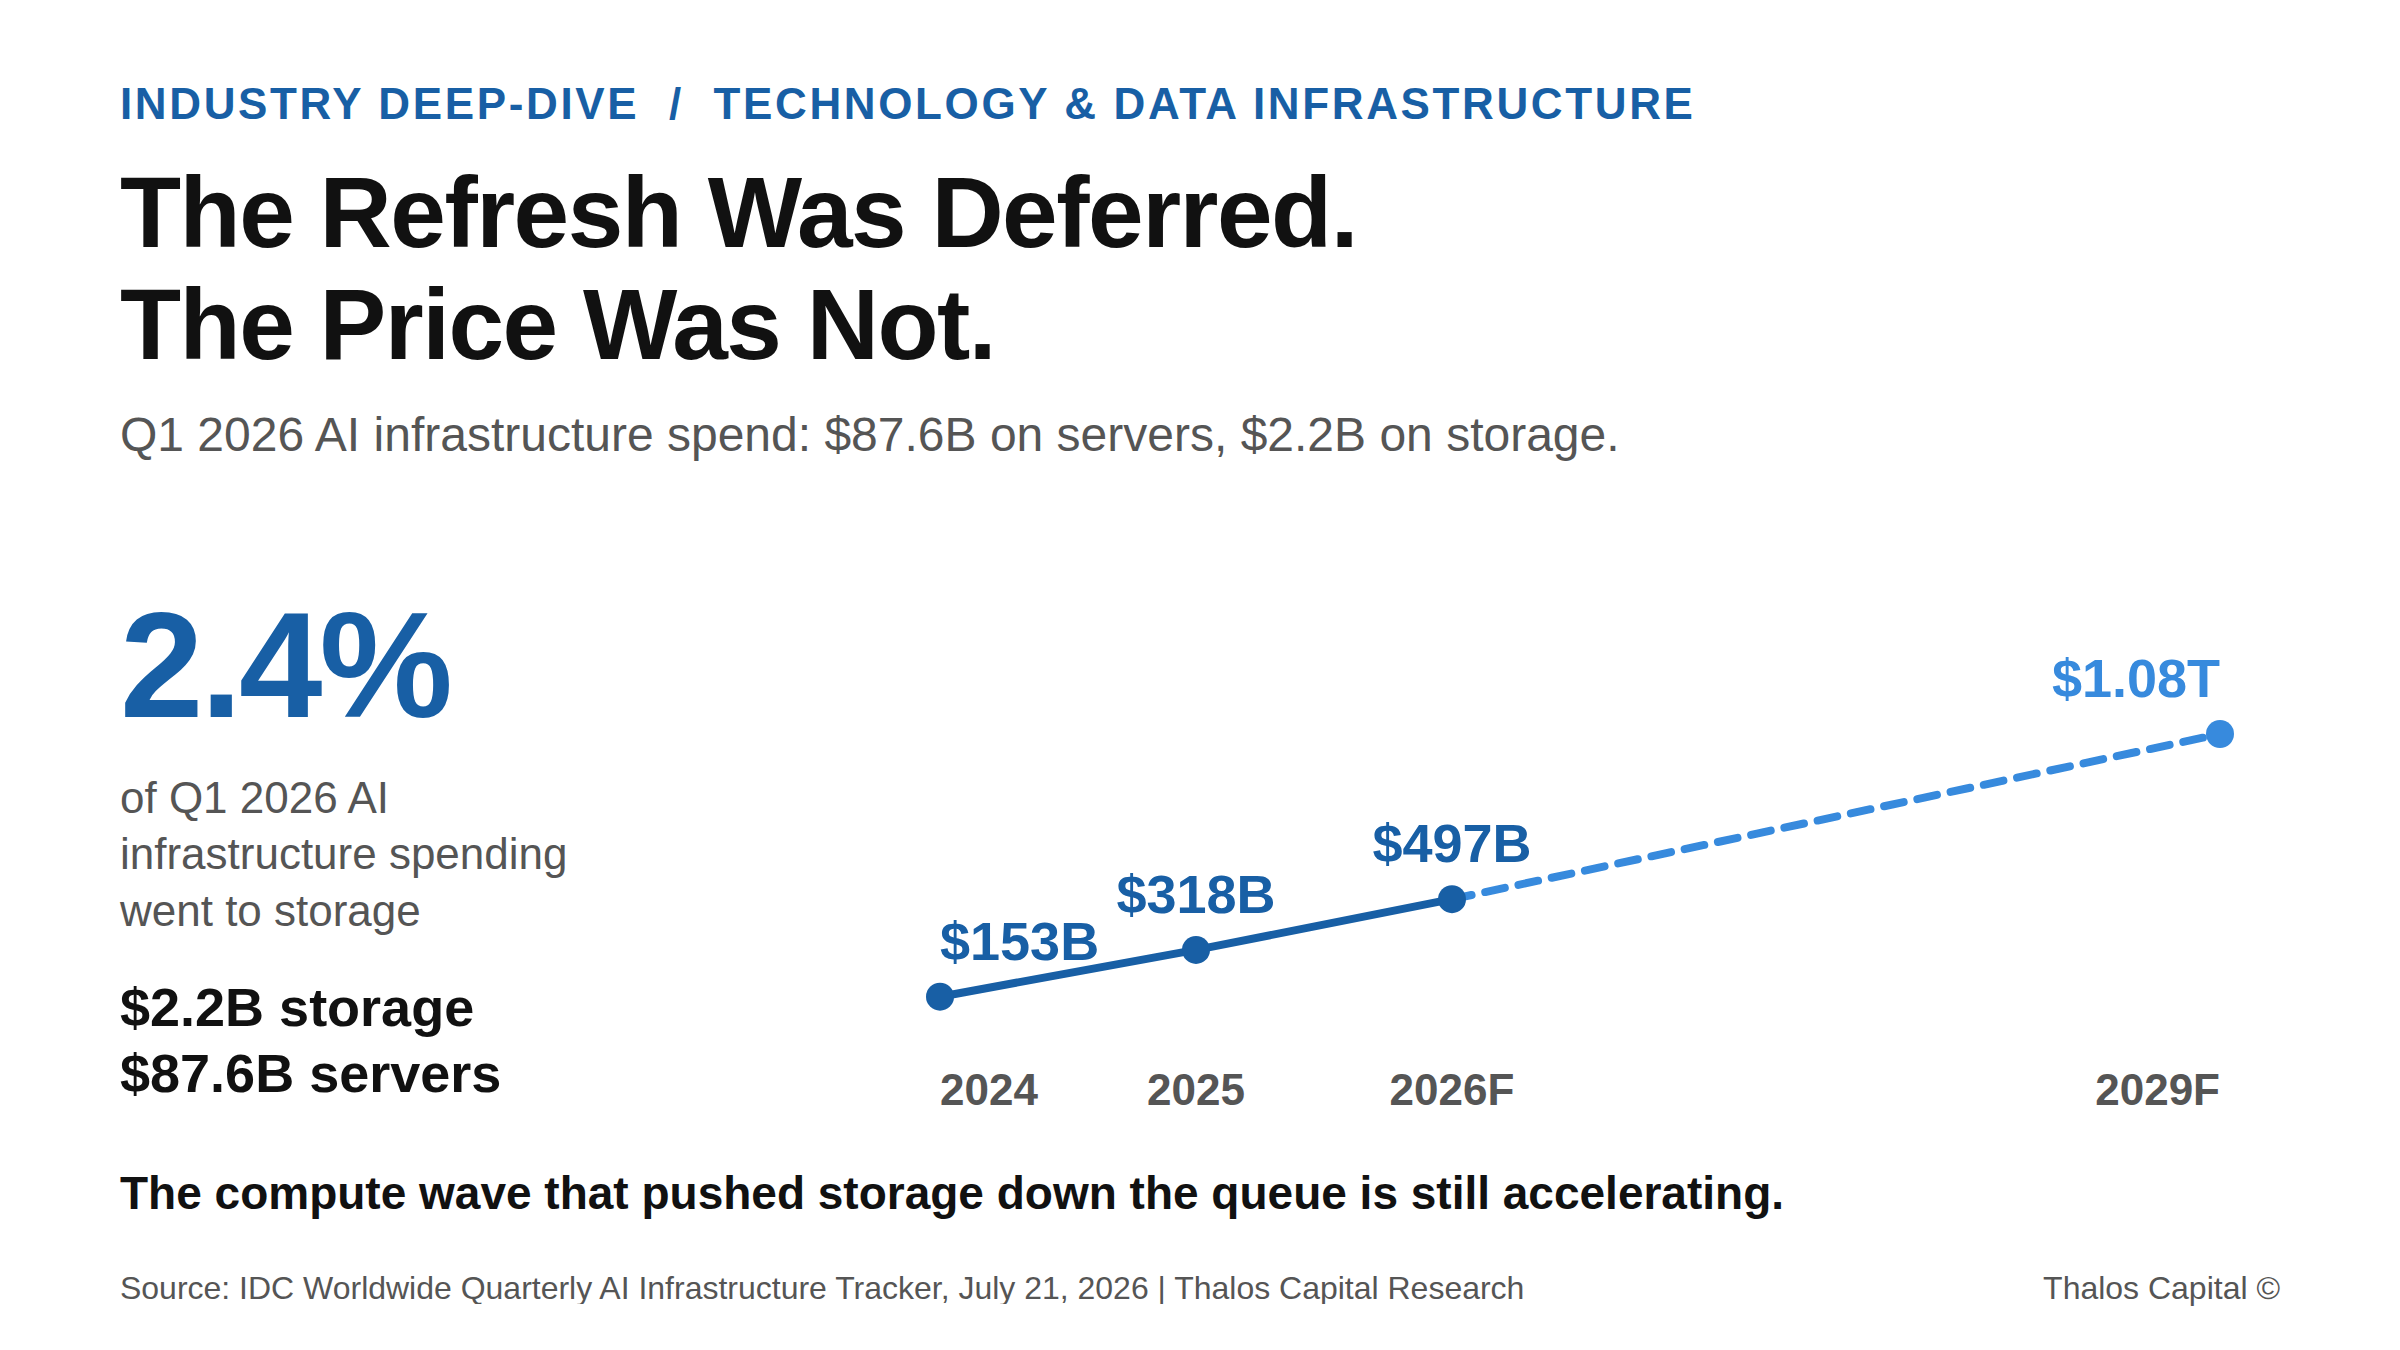
Trend line showing global AI infrastructure spending rising from $153B in 2024 to a forecast $497B in 2026 and $1.08T in 2029, with a callout that storage took 2.4 percent of Q1 2026 spending.

The Storage Refresh You Deferred Comes Due at 2026 Prices

Storage took 2.4% of Q1 2026 AI infrastructure spending. That deferral is expiring into a component market that has repriced every quarter. What it costs, and how to structure the refresh.
Read More
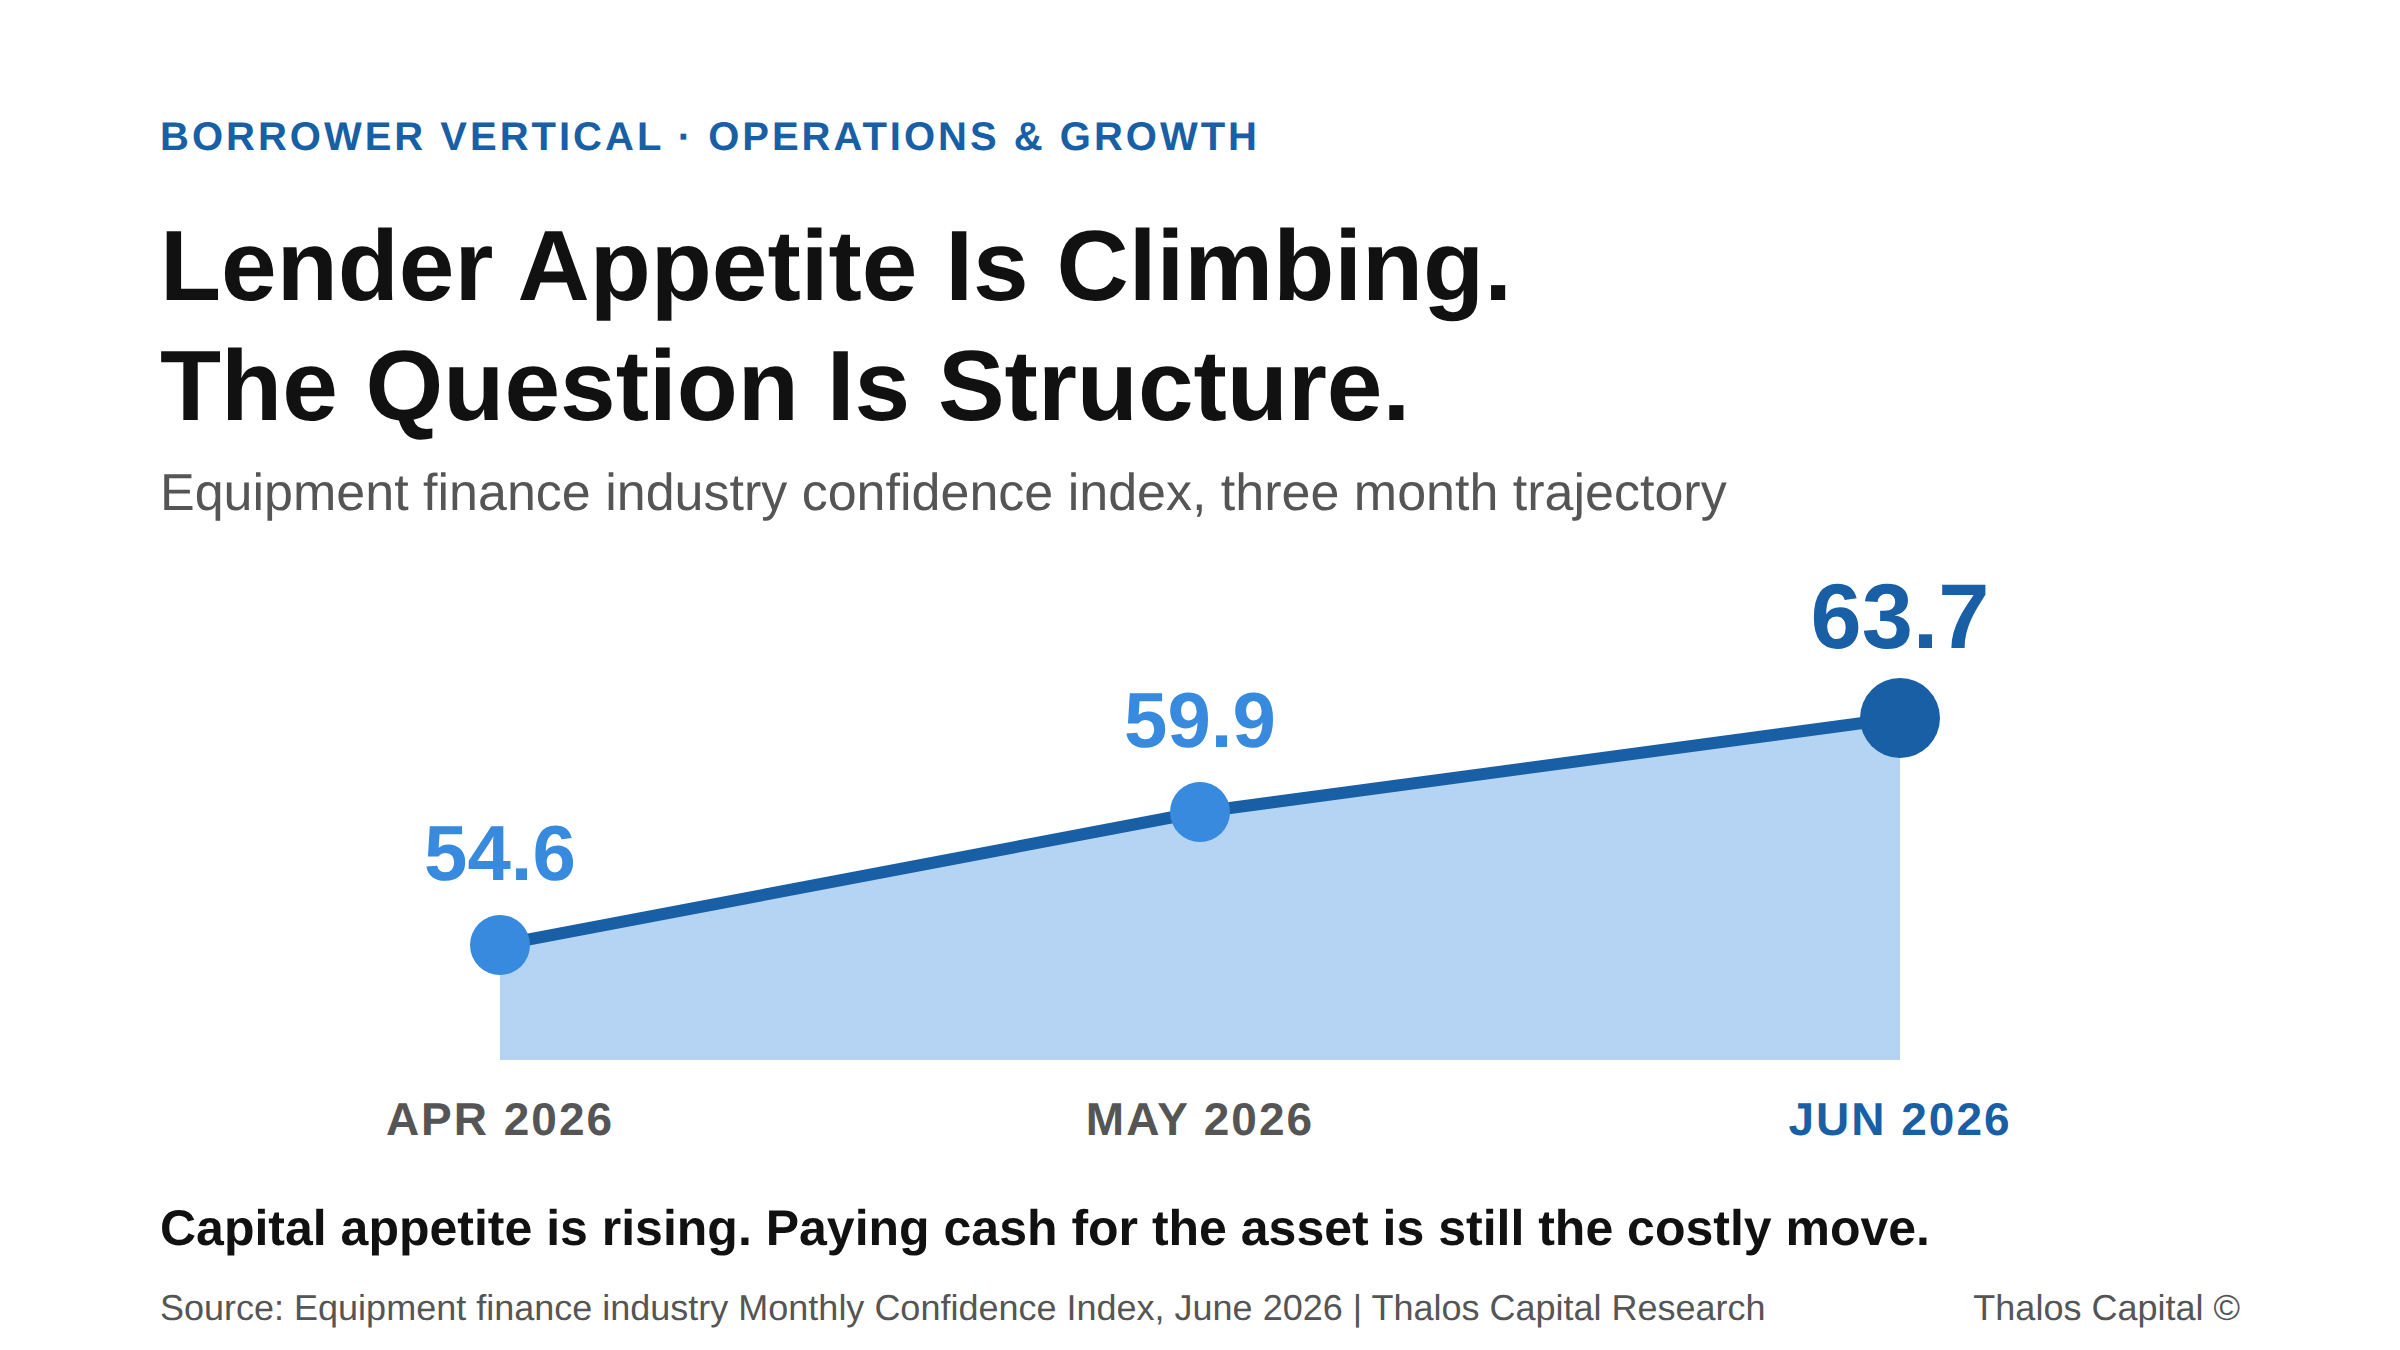
Filled area trend chart showing the equipment finance industry monthly confidence index climbing from 54.6 in April 2026 to 59.9 in May to 63.7 in June.

Paying Cash for Equipment Is Not the Conservative Move. It Is the Expensive One.

Capex demand is rising into a working capital squeeze. Why paying cash for equipment is the expensive move, and how layering the structure preserves the liquidity growth consumes.
Read More
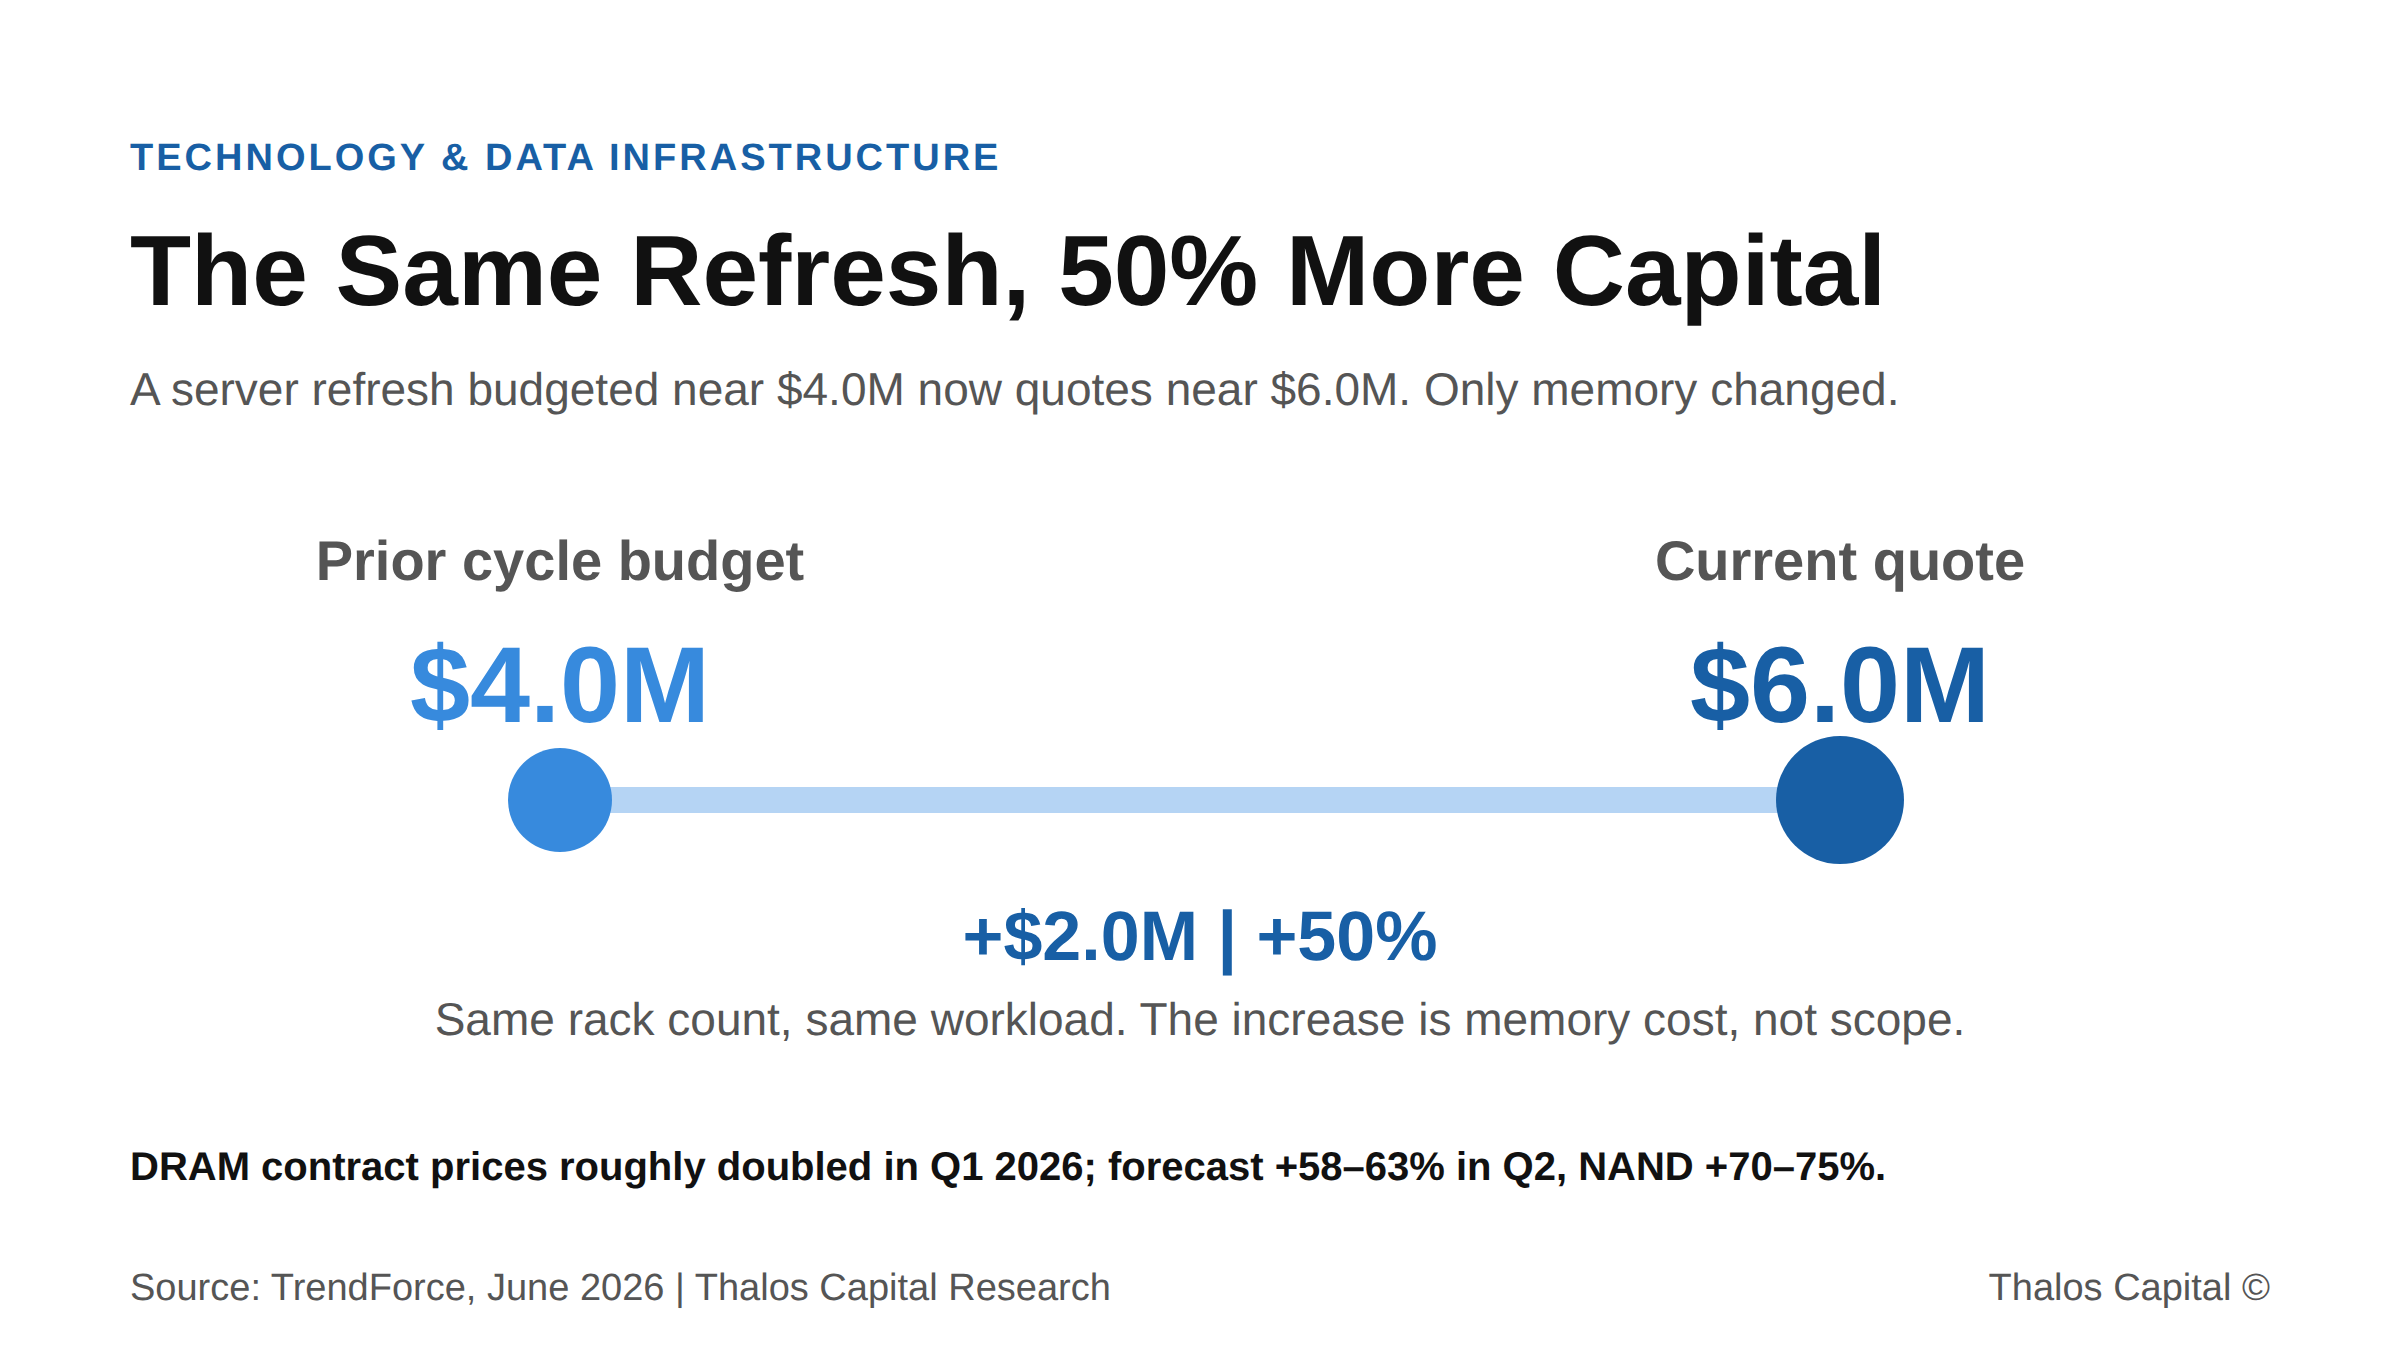
Two-point range chart showing a data-infrastructure refresh rising from a $4.0M prior-cycle budget to a $6.0M current quote, a 50 percent increase driven by 2026 memory price inflation.

The Same Server Refresh Now Costs 50% More: How One Operator Funded It Without Draining the Business

Memory prices doubled in 2026, pushing a $4M server refresh to $6M. How structuring the financing, not paying cash, preserves the liquidity that runs the business.
Read More
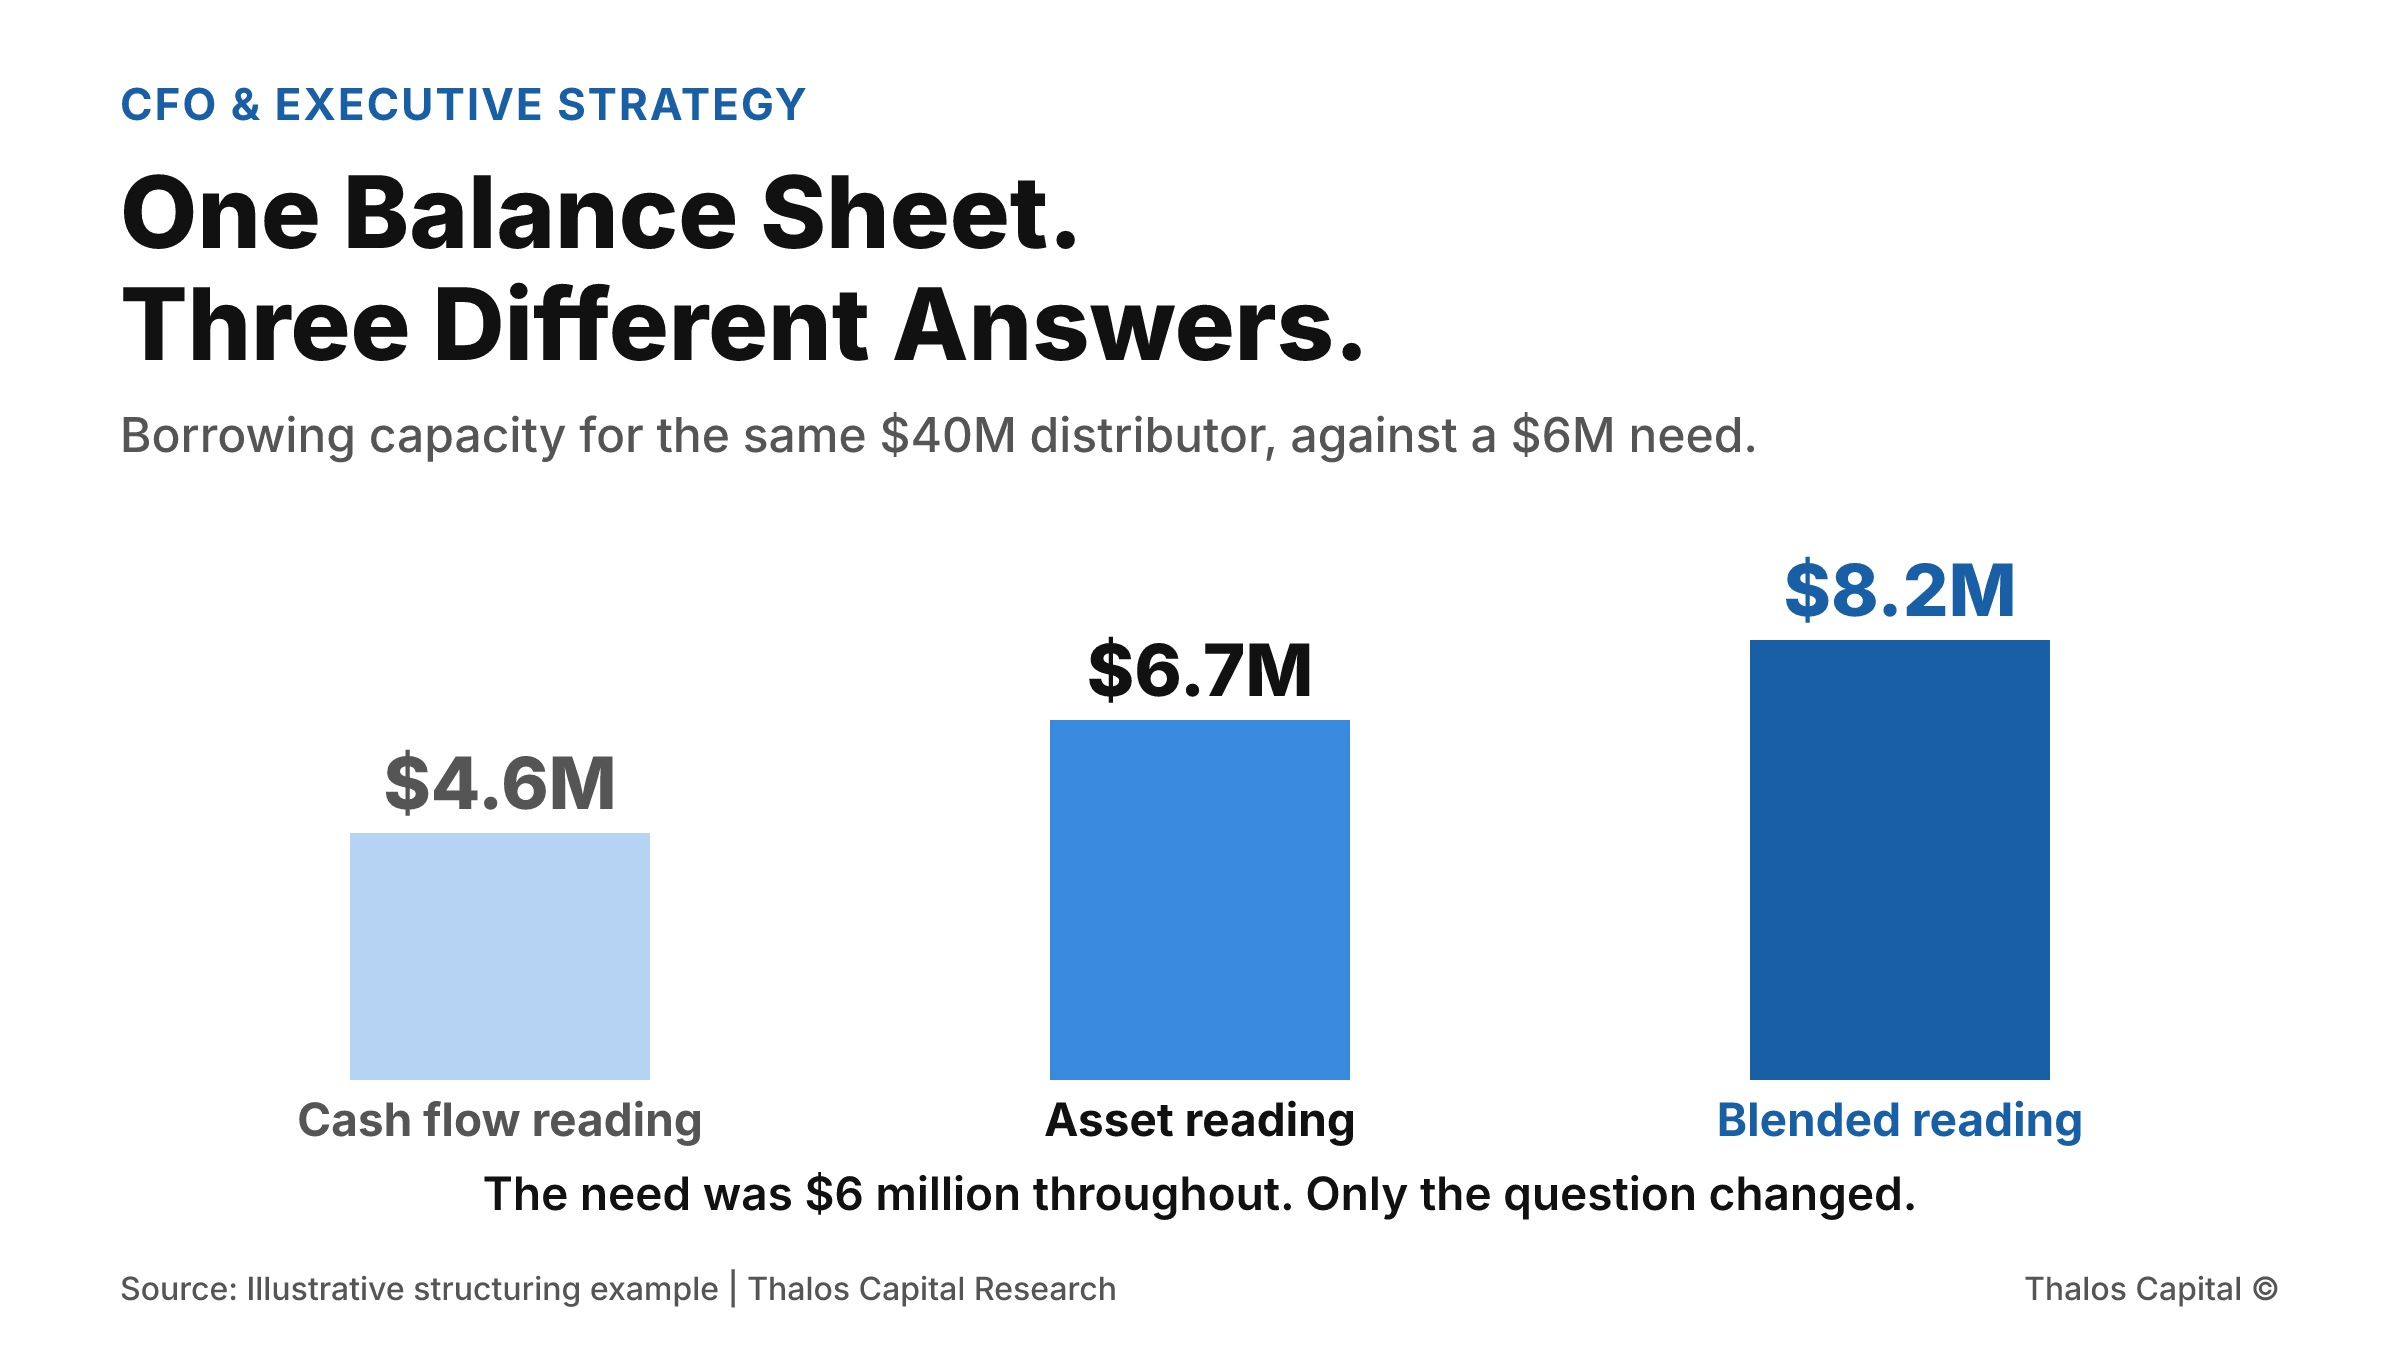
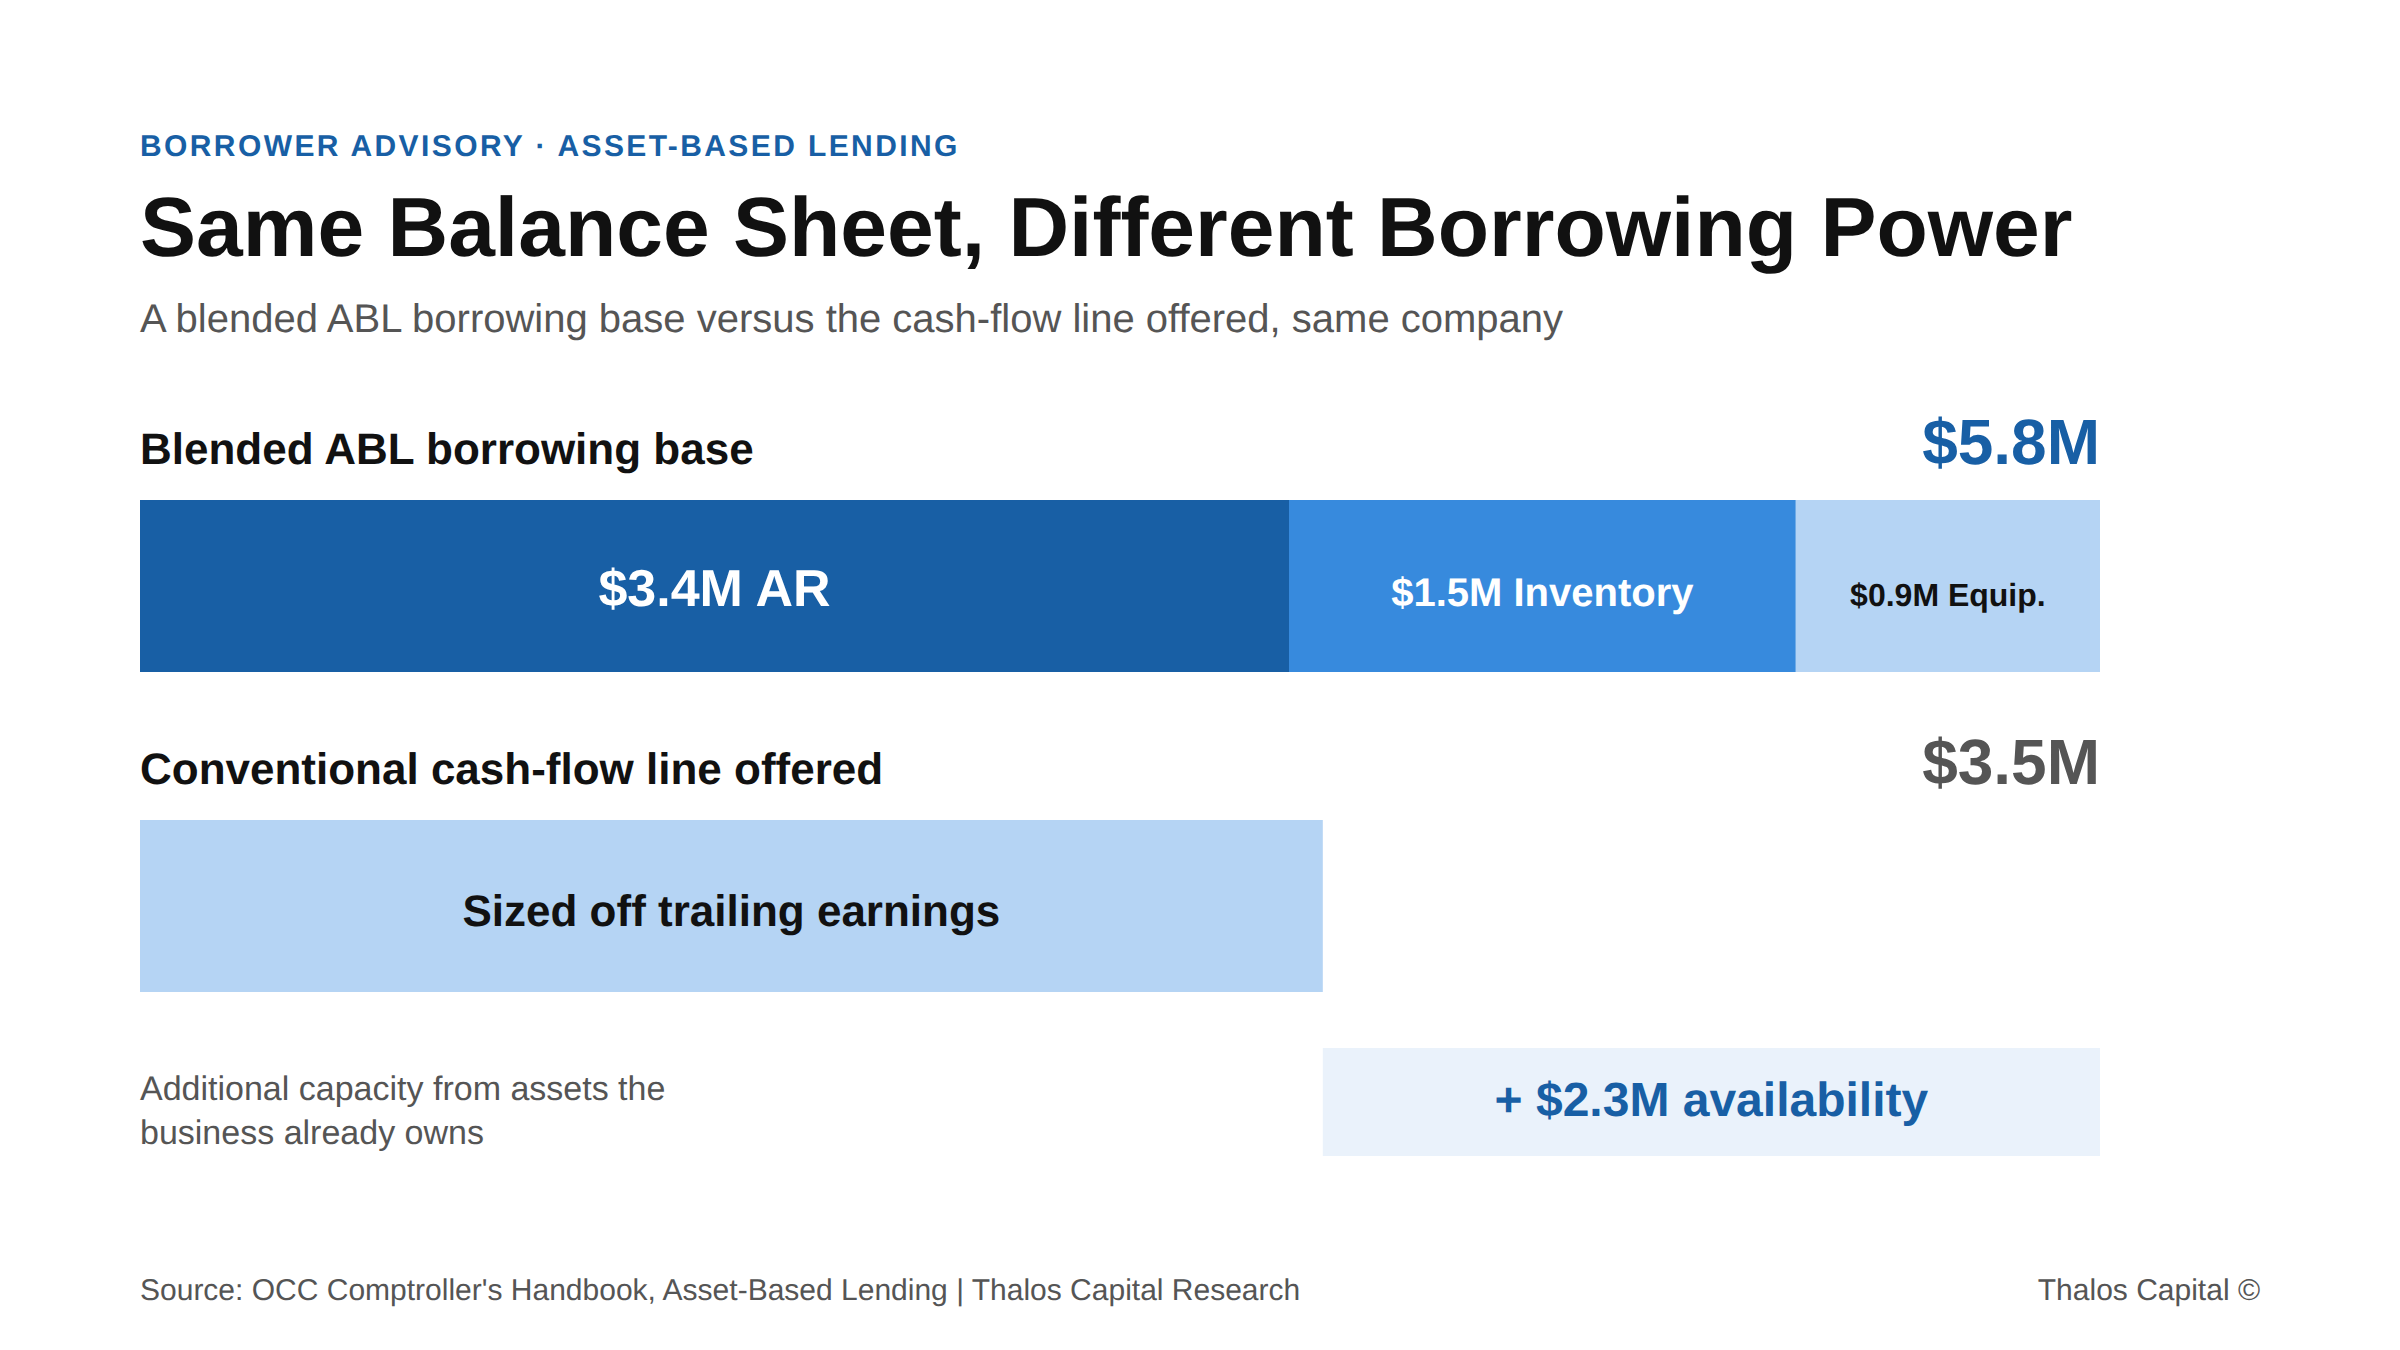
Single stacked bar. how a blended borrowing base is built, against the cash-flow line offered.

Asset-Rich, Credit-Capped: Why Tightening Operators Borrow Against the Wrong Thing

Asset-rich operators tightening through rising costs often borrow against the wrong thing. Why a cash-flow line caps capacity the balance sheet could exceed, with the numbers.
Read More
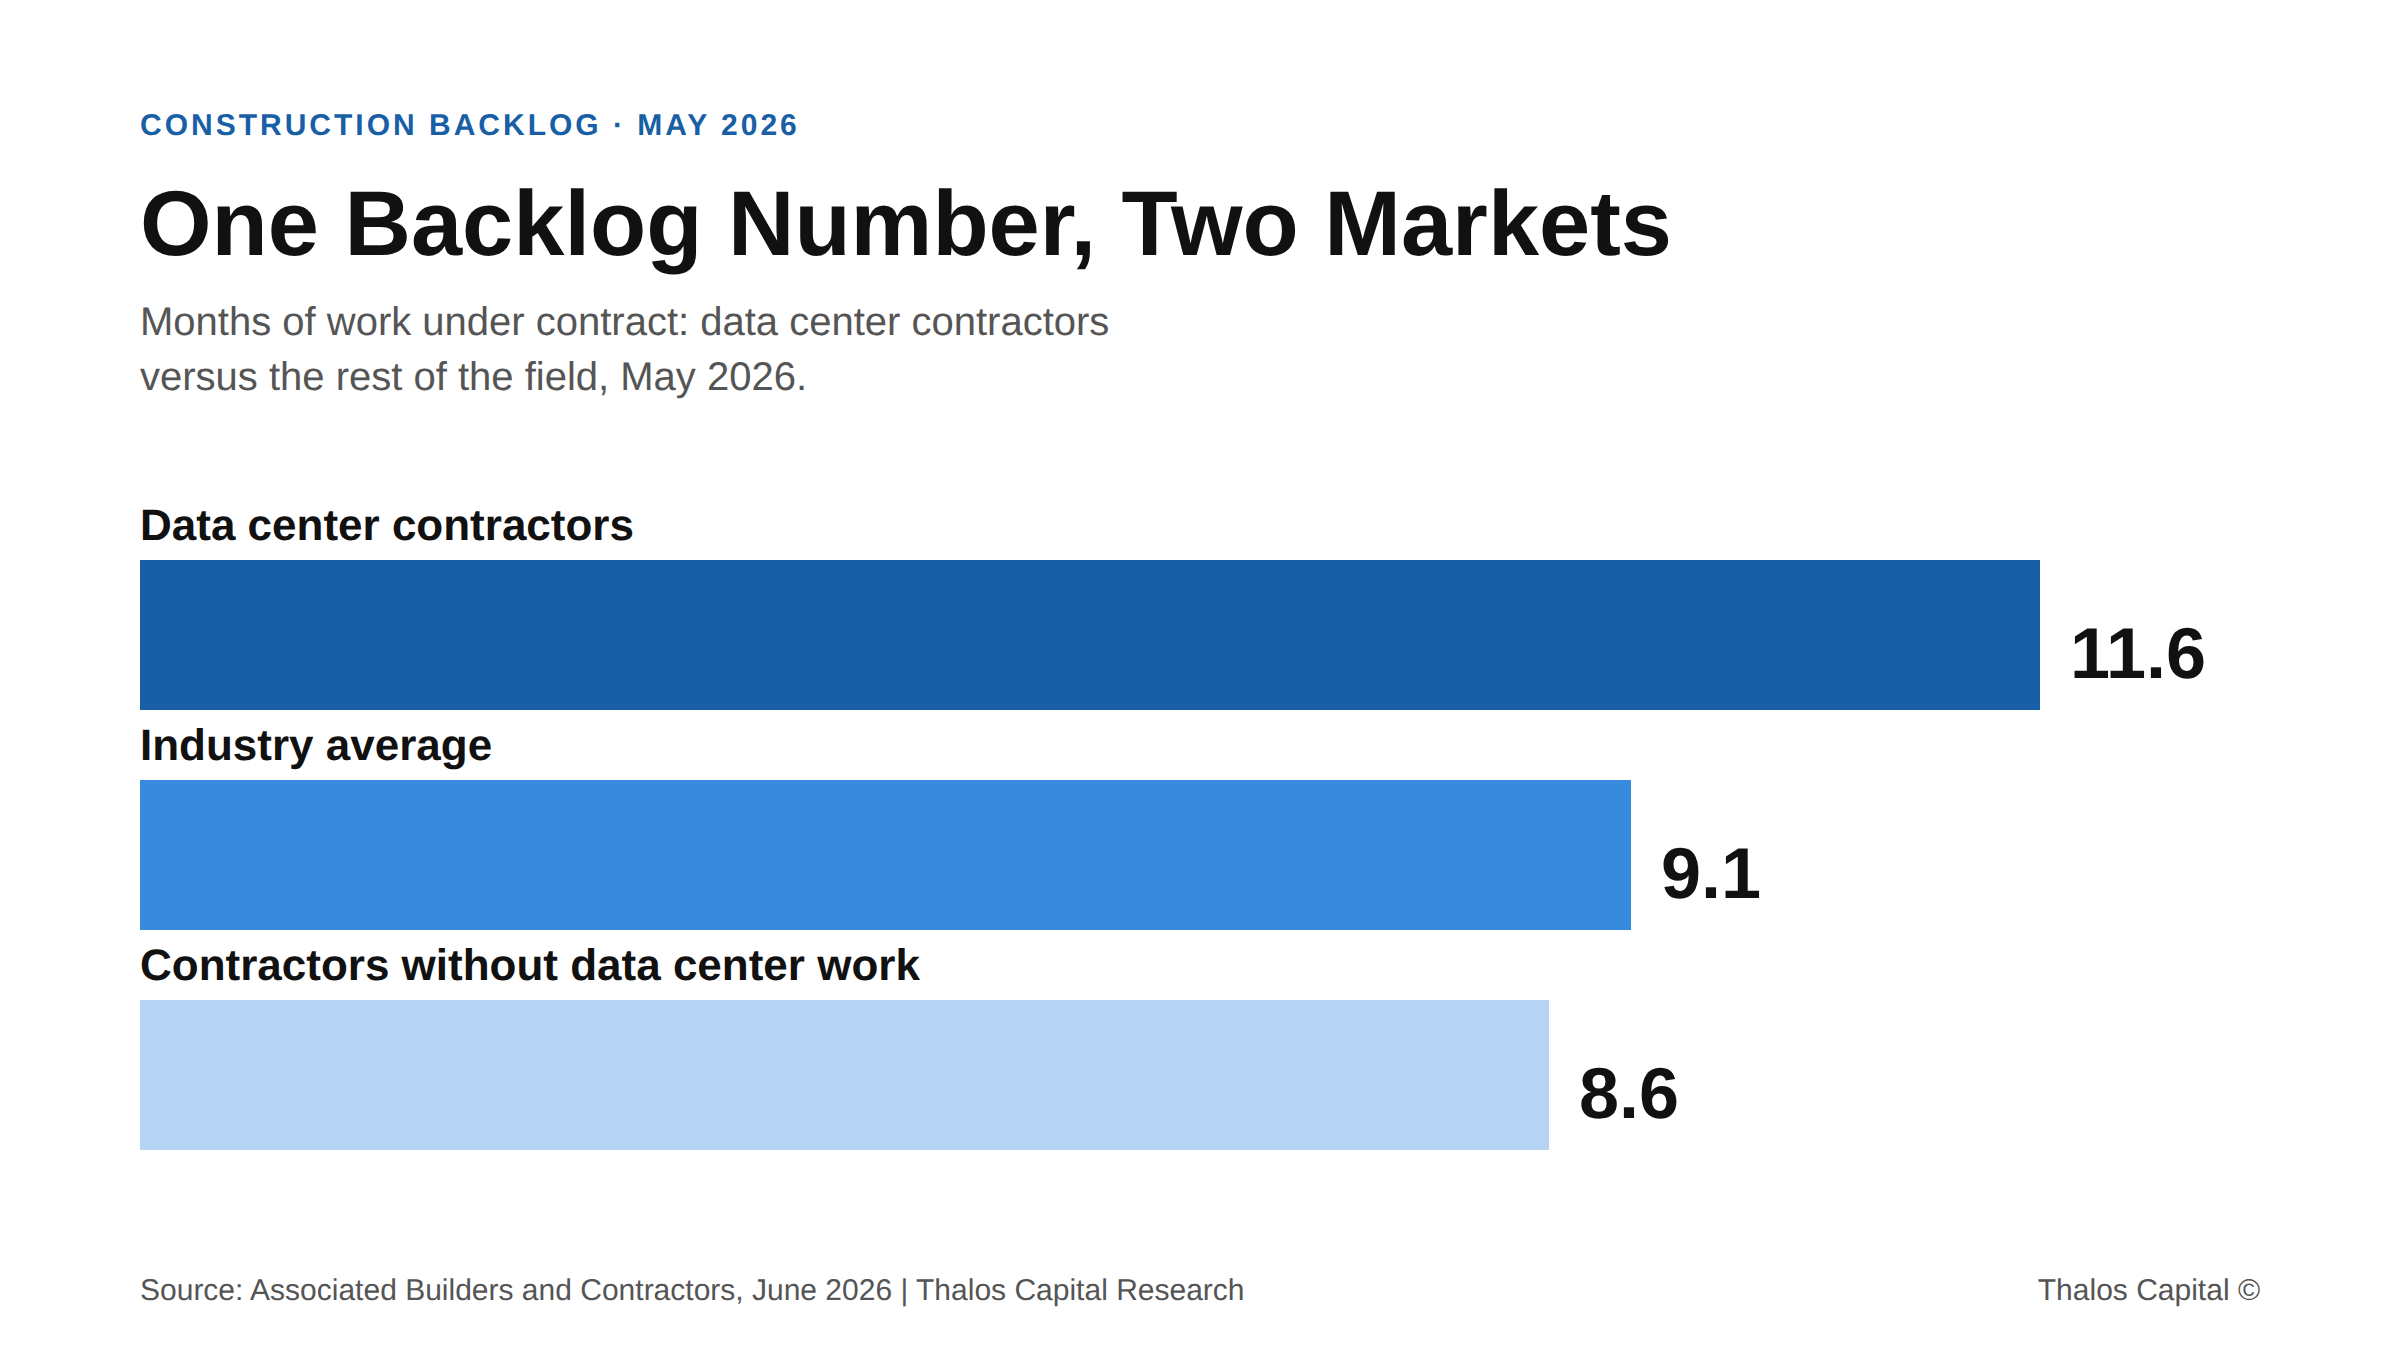
Horizontal bar chart showing construction backlog of 11.6 months for data center contractors, 9.1 months industry average, and 8.6 months for contractors without data center work, May 2026

The Three-Month Backlog Gap Now Splitting the Construction Market

Construction backlog hit a three-year high in May, but the gain is concentrated in data center work. Why the 86% of contractors outside that lane risk being priced off a market they do not occupy.
Read More
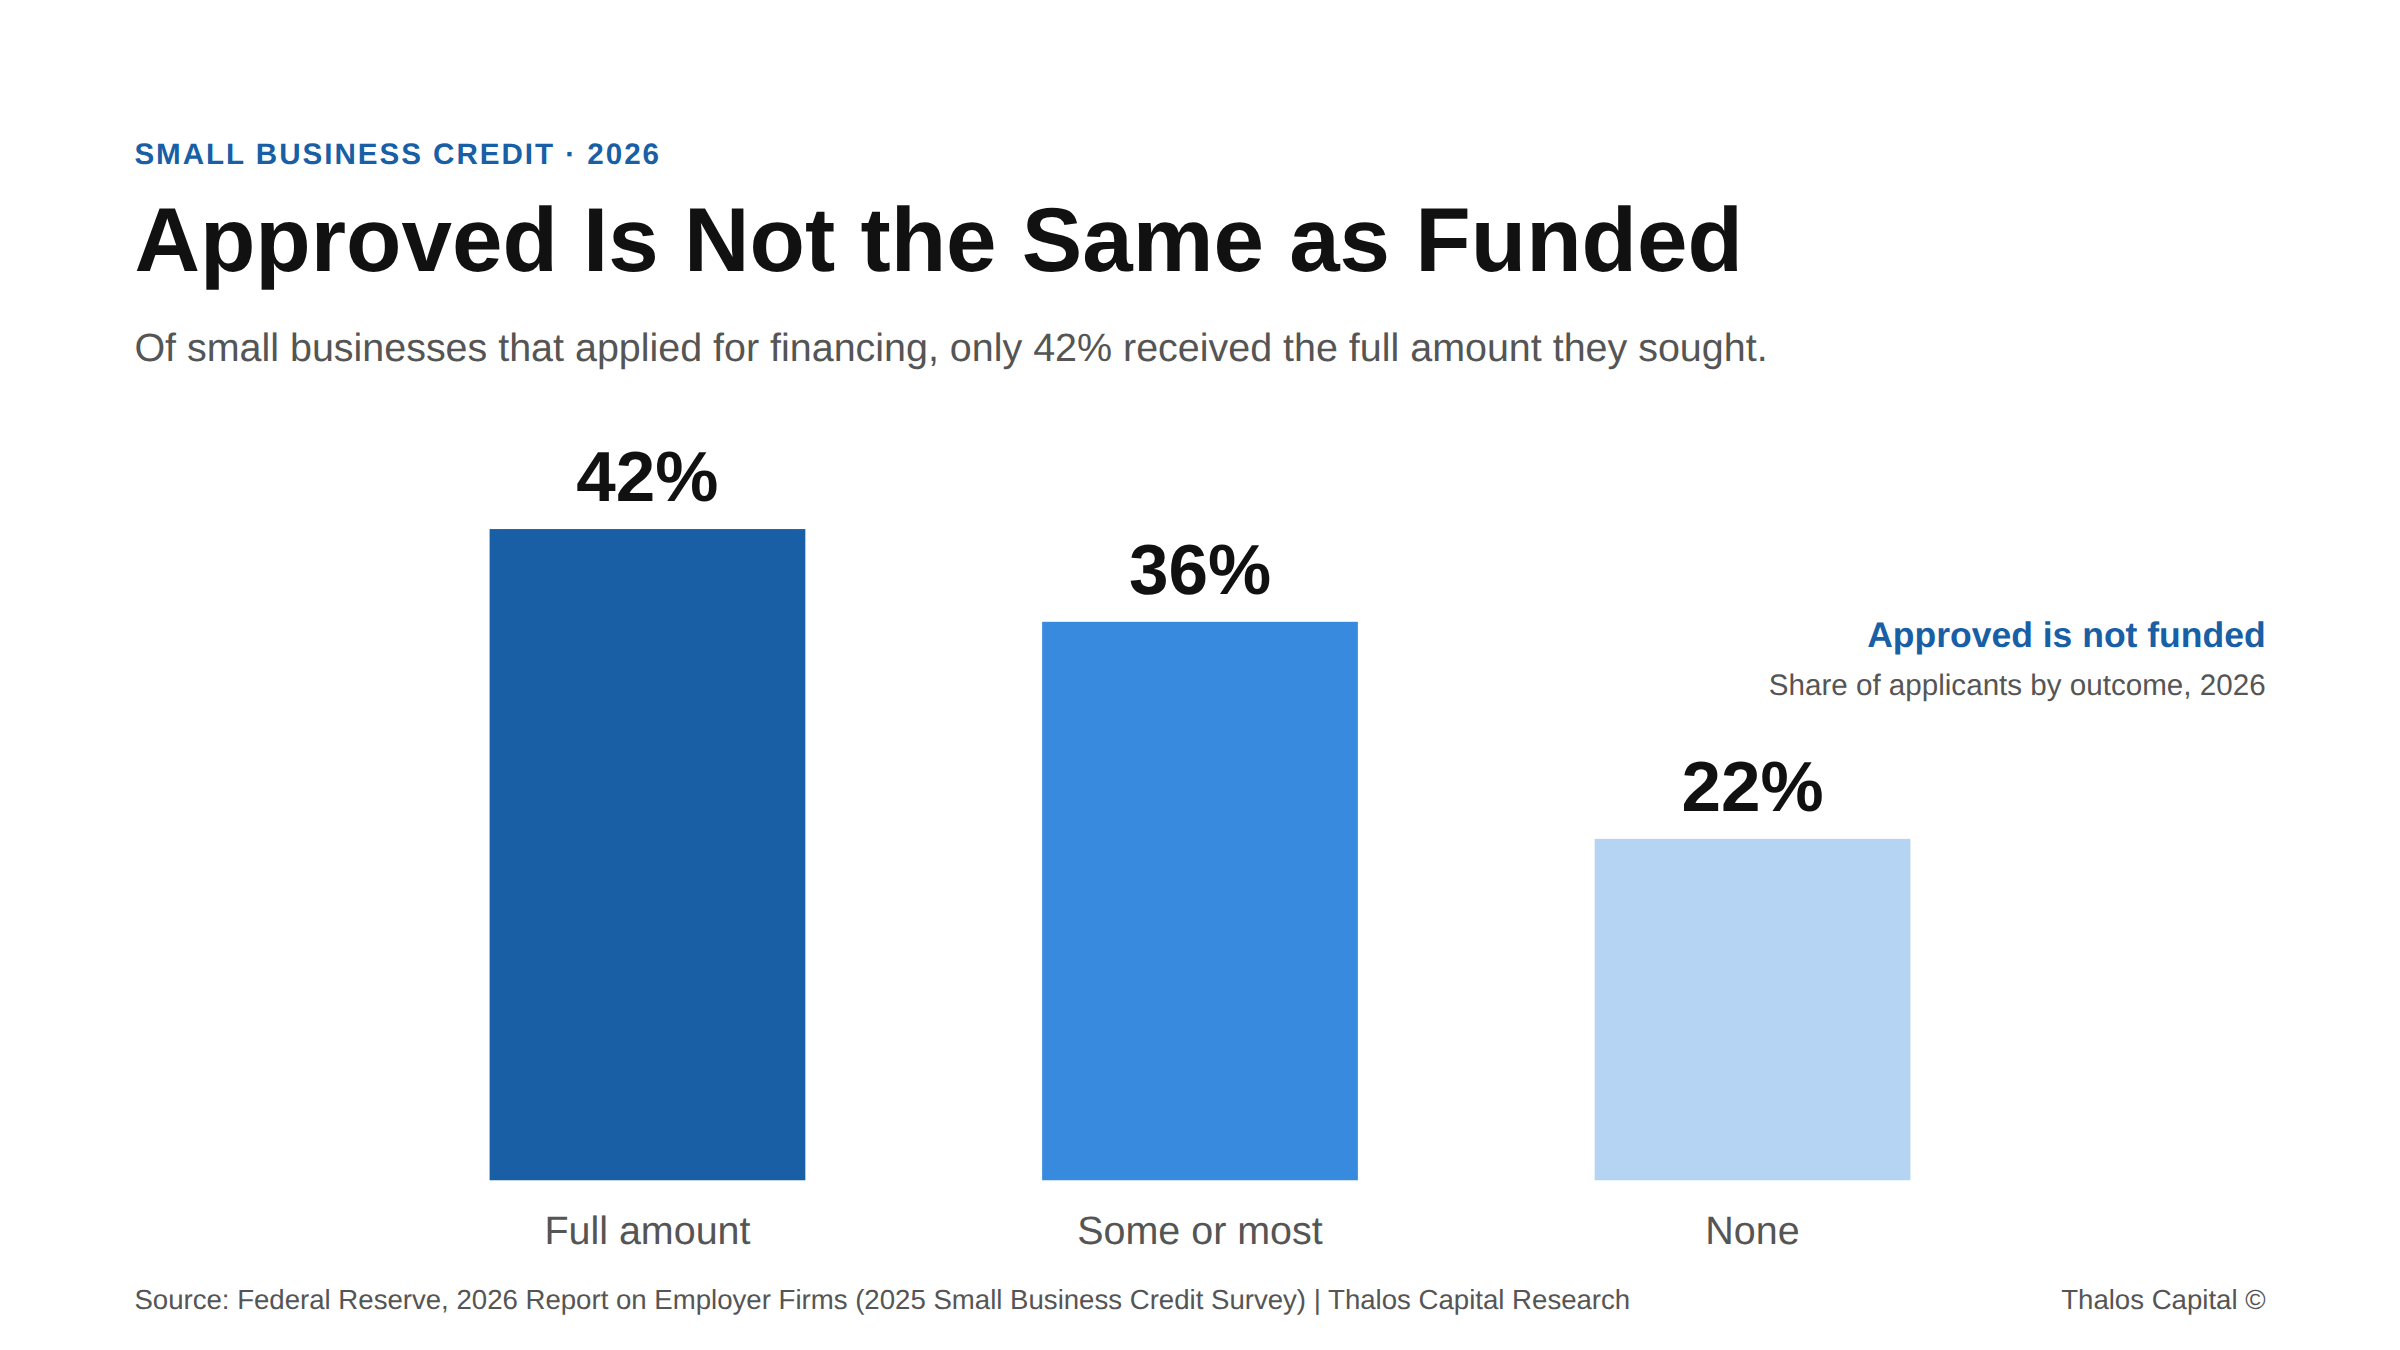
Bar chart showing 42 percent of small business financing applicants received the full amount, 36 percent some or most, 22 percent none.

Getting Approved Is Not Getting Funded: The 42% Problem

Only 42% of small businesses get the full financing they request. Why partial approval is the most expensive outcome, and what fully funded borrowers do differently.
Read More
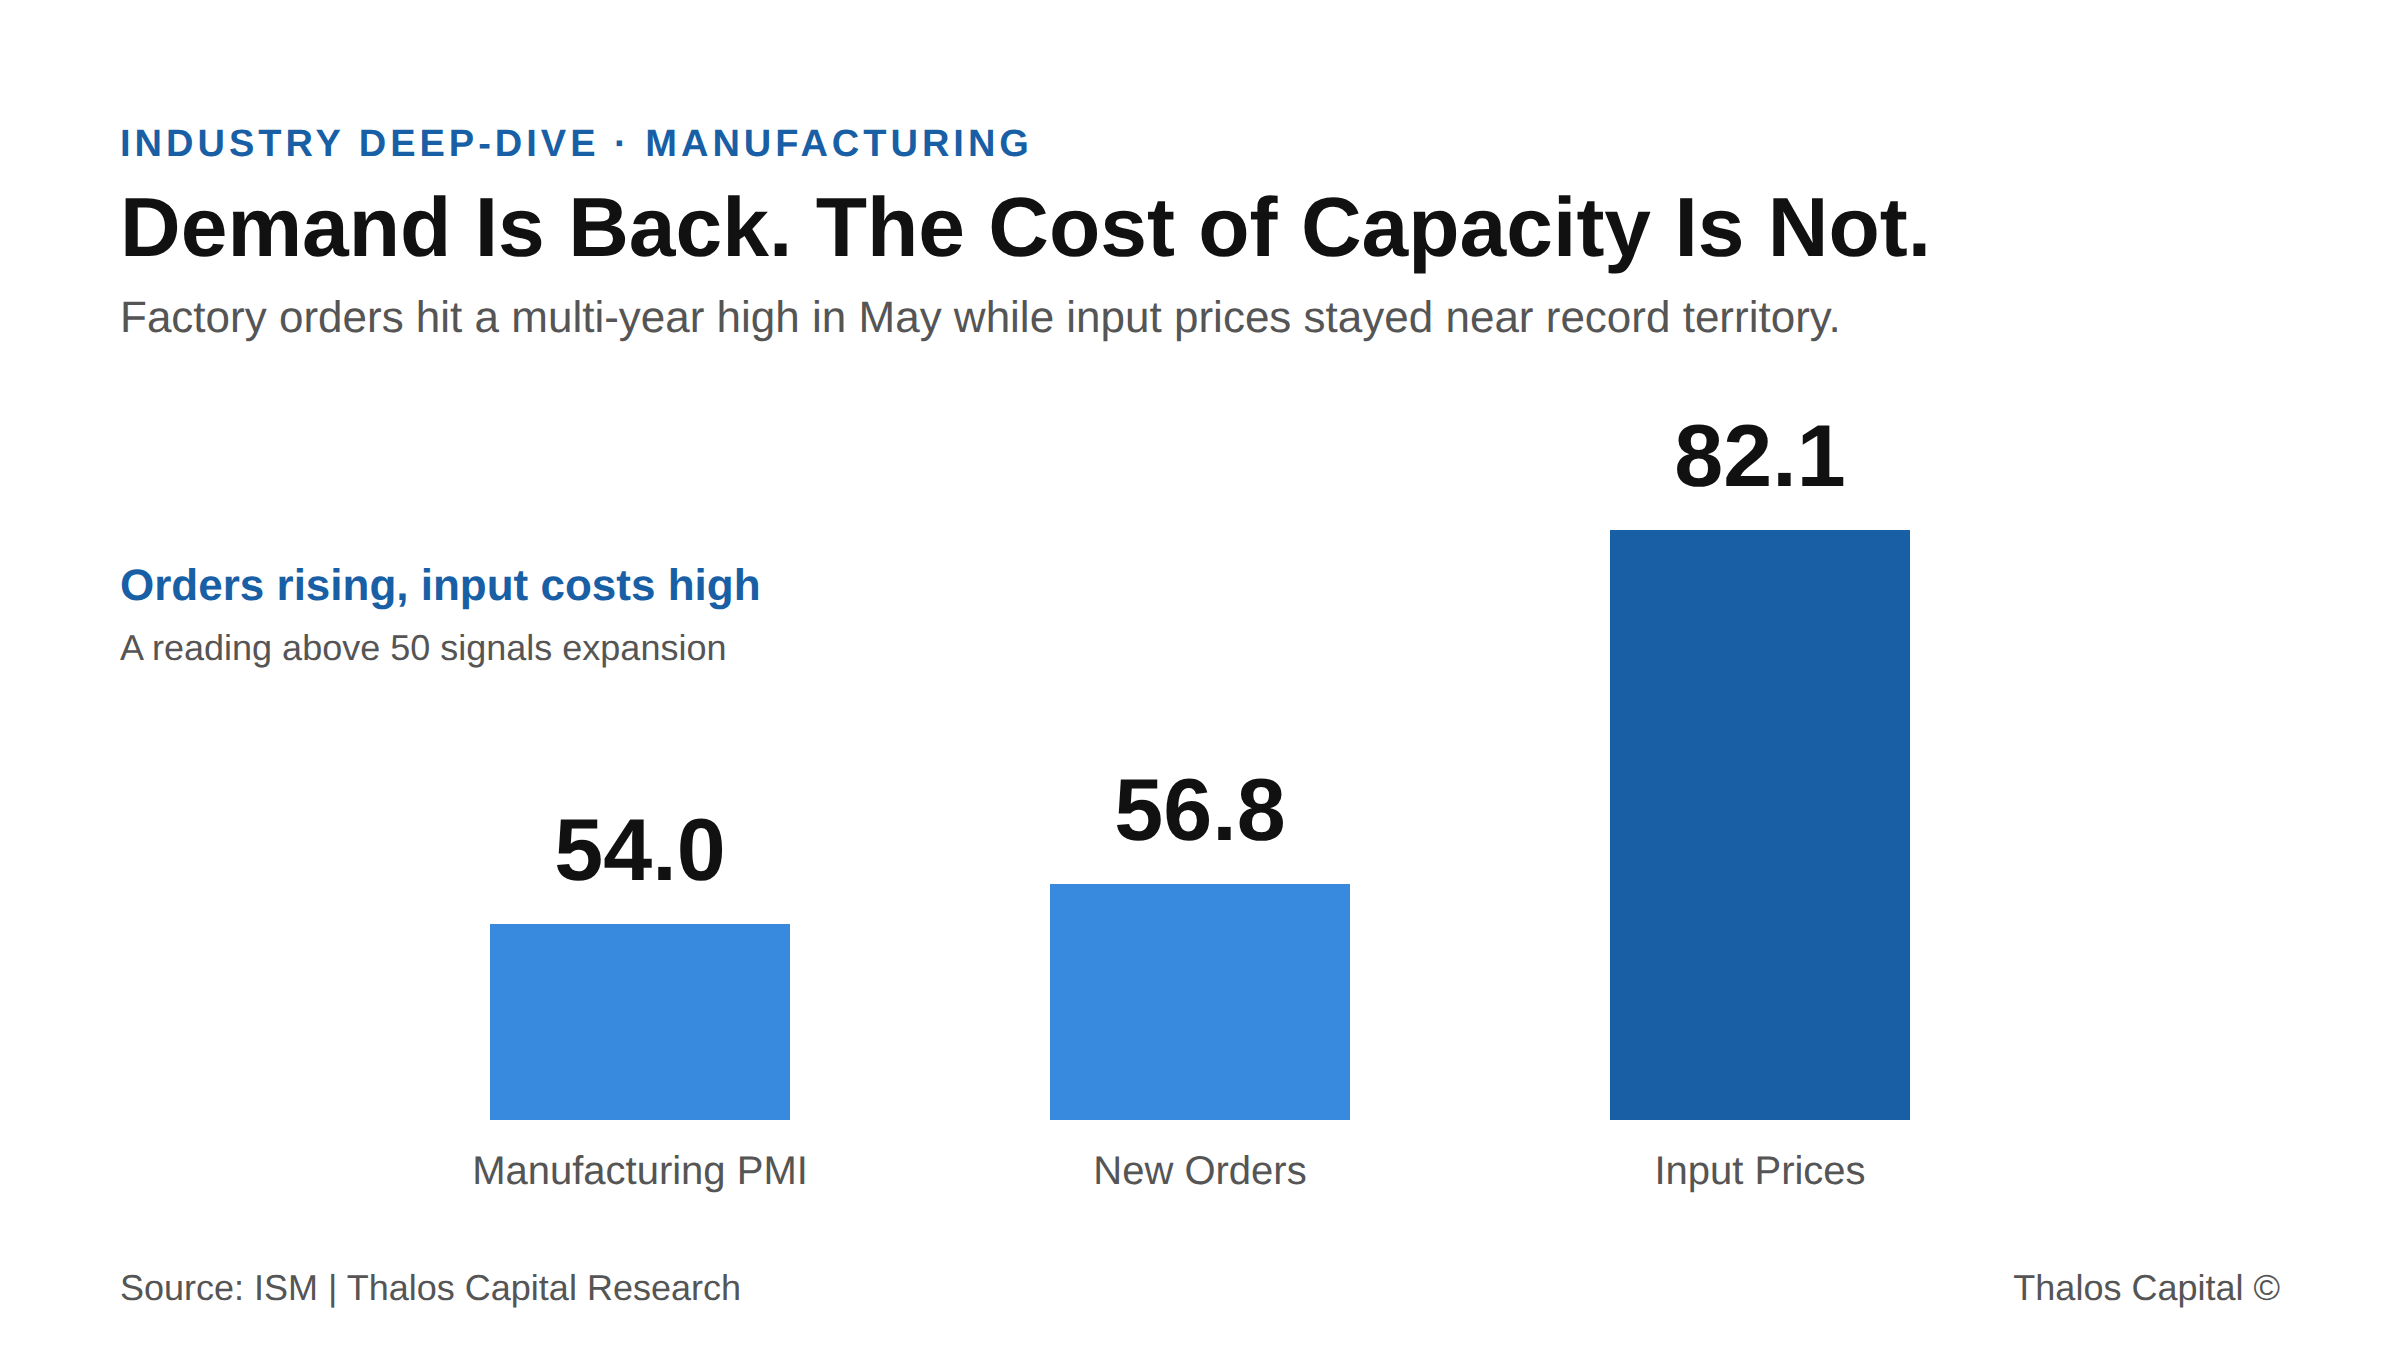
Bar chart of May 2026 ISM manufacturing readings showing the PMI at 54.0, New Orders at 56.8, and the Prices Index at 82.1, with demand expanding while input prices stay elevated.

The Order Came In. The Cash to Fill It Did Not.

Manufacturing demand hit a multi-year high in May while input prices stayed near record levels. Why funding capacity now depends on how equipment and working capital financing is structured and sourced.
Read More
Working through a financing decision?
Insights are a starting point. A conversation maps your actual options.
Tell us what you are financing and we will map the structures and sources that fit.
Submit your financing request →
Explore our financing solutions
Equipment FinancingWorking CapitalAsset-Based LendingStrategic Debt