Tag

equipment financing

11 insights

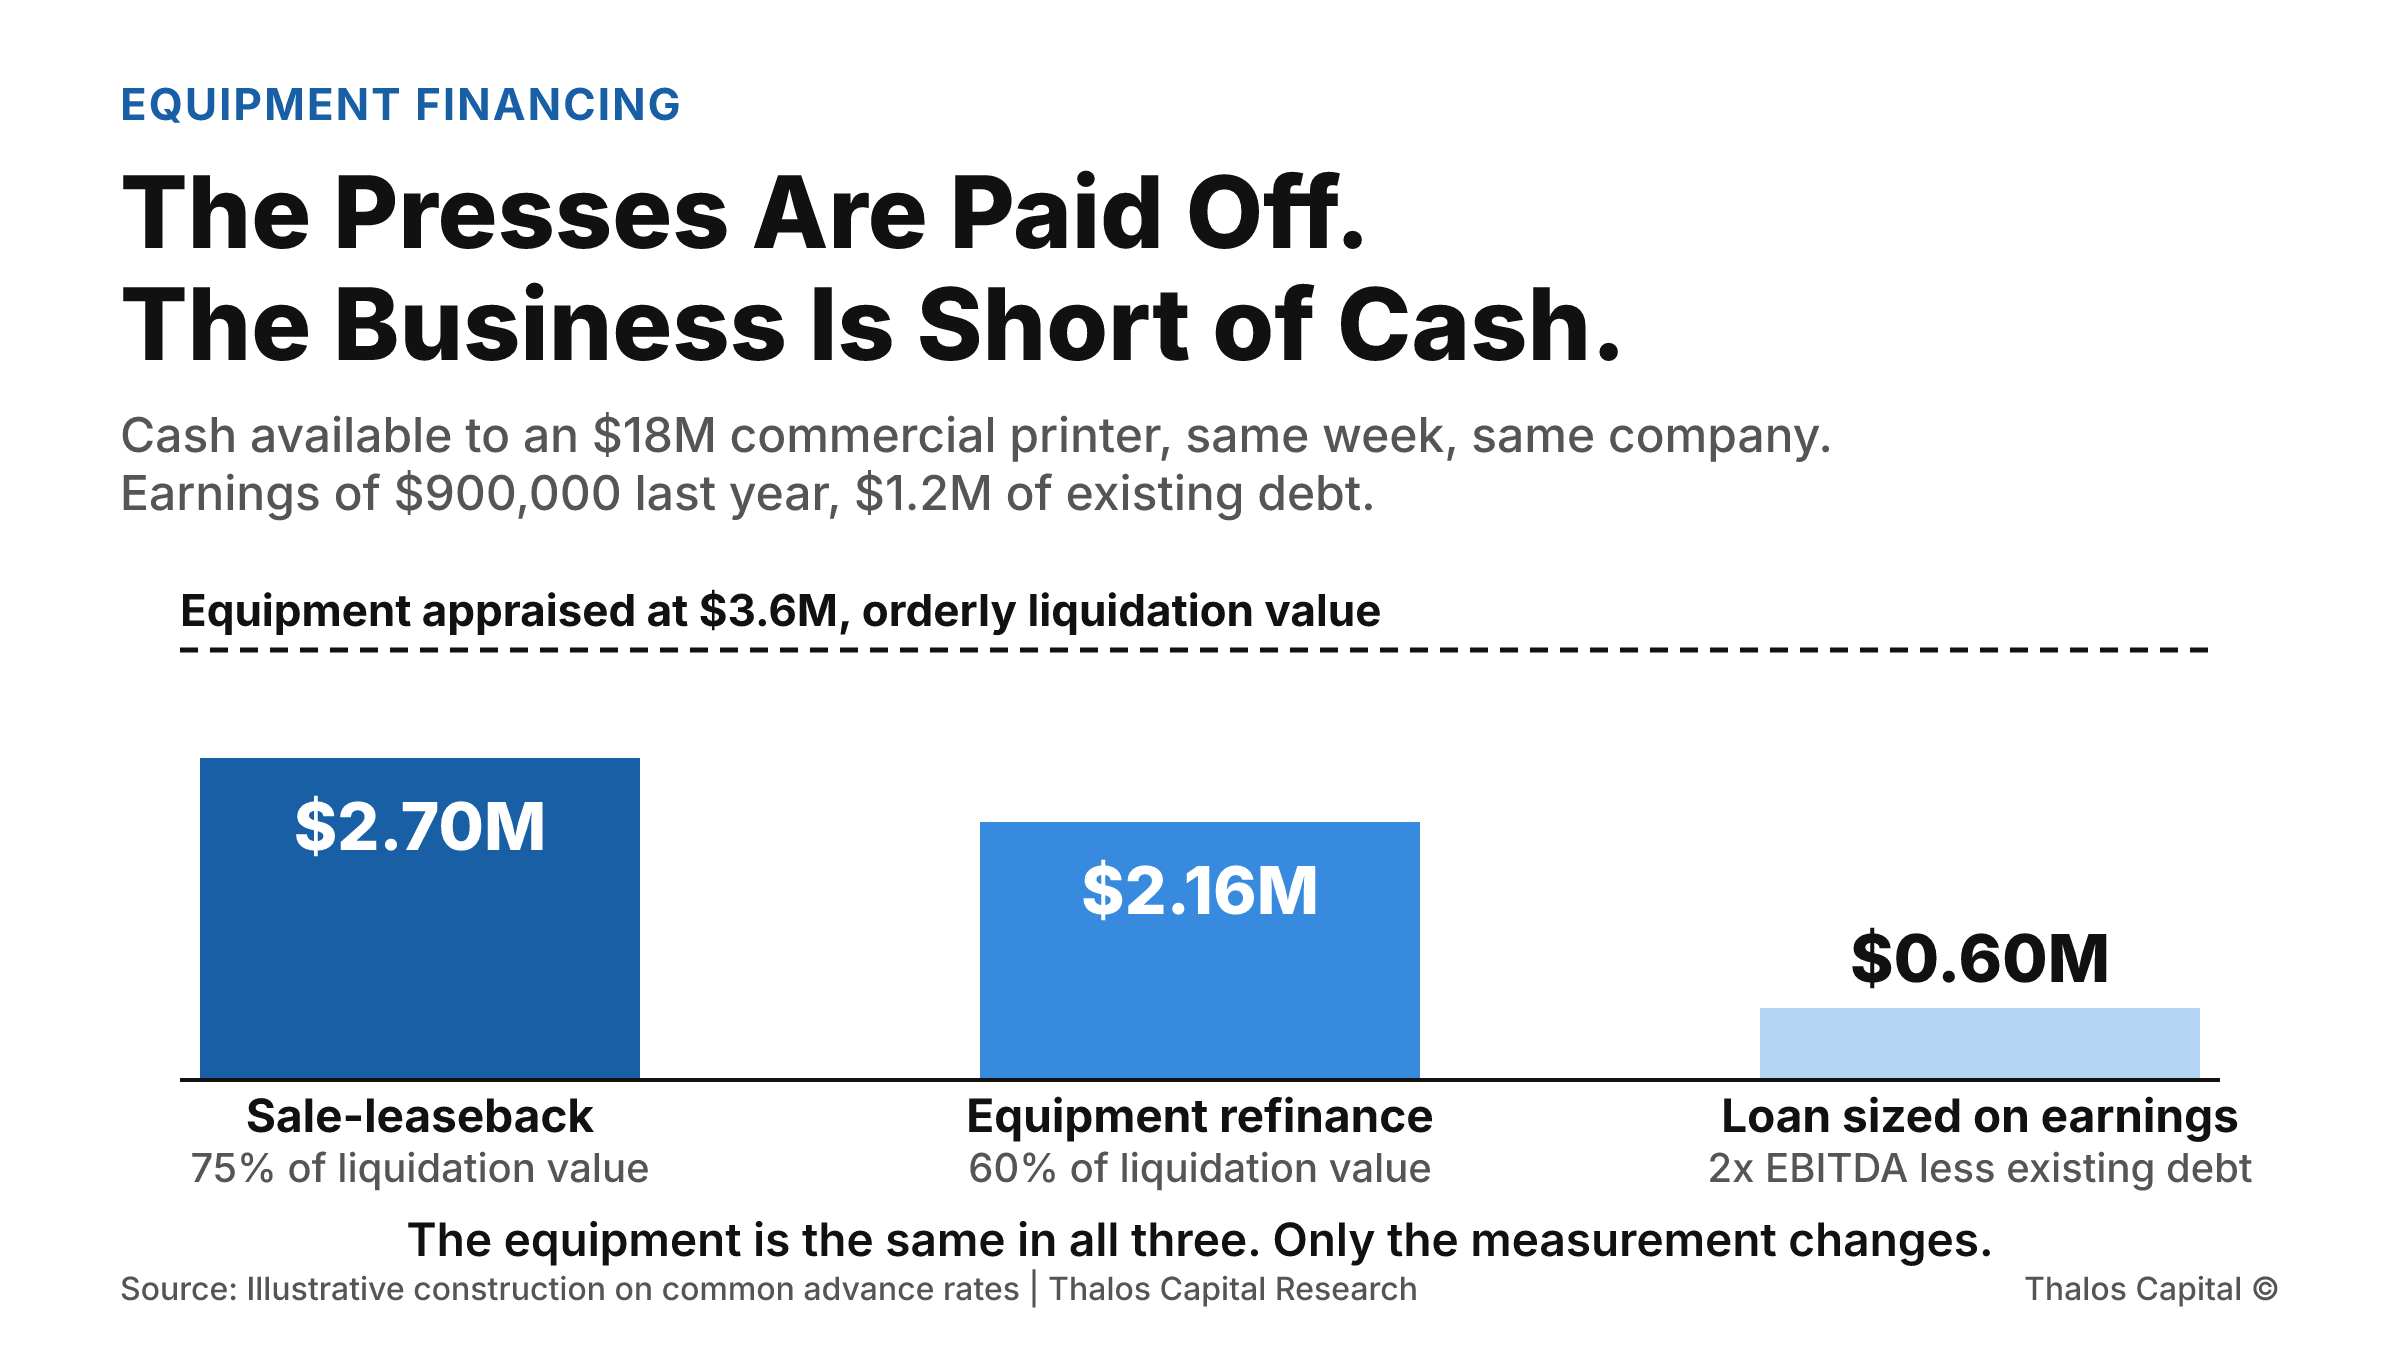
Three columns of cash available to a commercial printer. A sale-leaseback of owned presses raises $2.70 million, an equipment-secured refinance raises $2.16 million, and a loan sized on last year's earnings raises $600,000, against equipment appraised at $3.6 million.

The Presses Are Paid Off. The Business Is Short of Cash.

A commercial printer owns $3.6 million of appraised equipment and can borrow $600,000 on last year's earnings. A sale-leaseback on the same presses raises $2.7 million, at $69,800 a month and $650,000 of total cost.
Read More
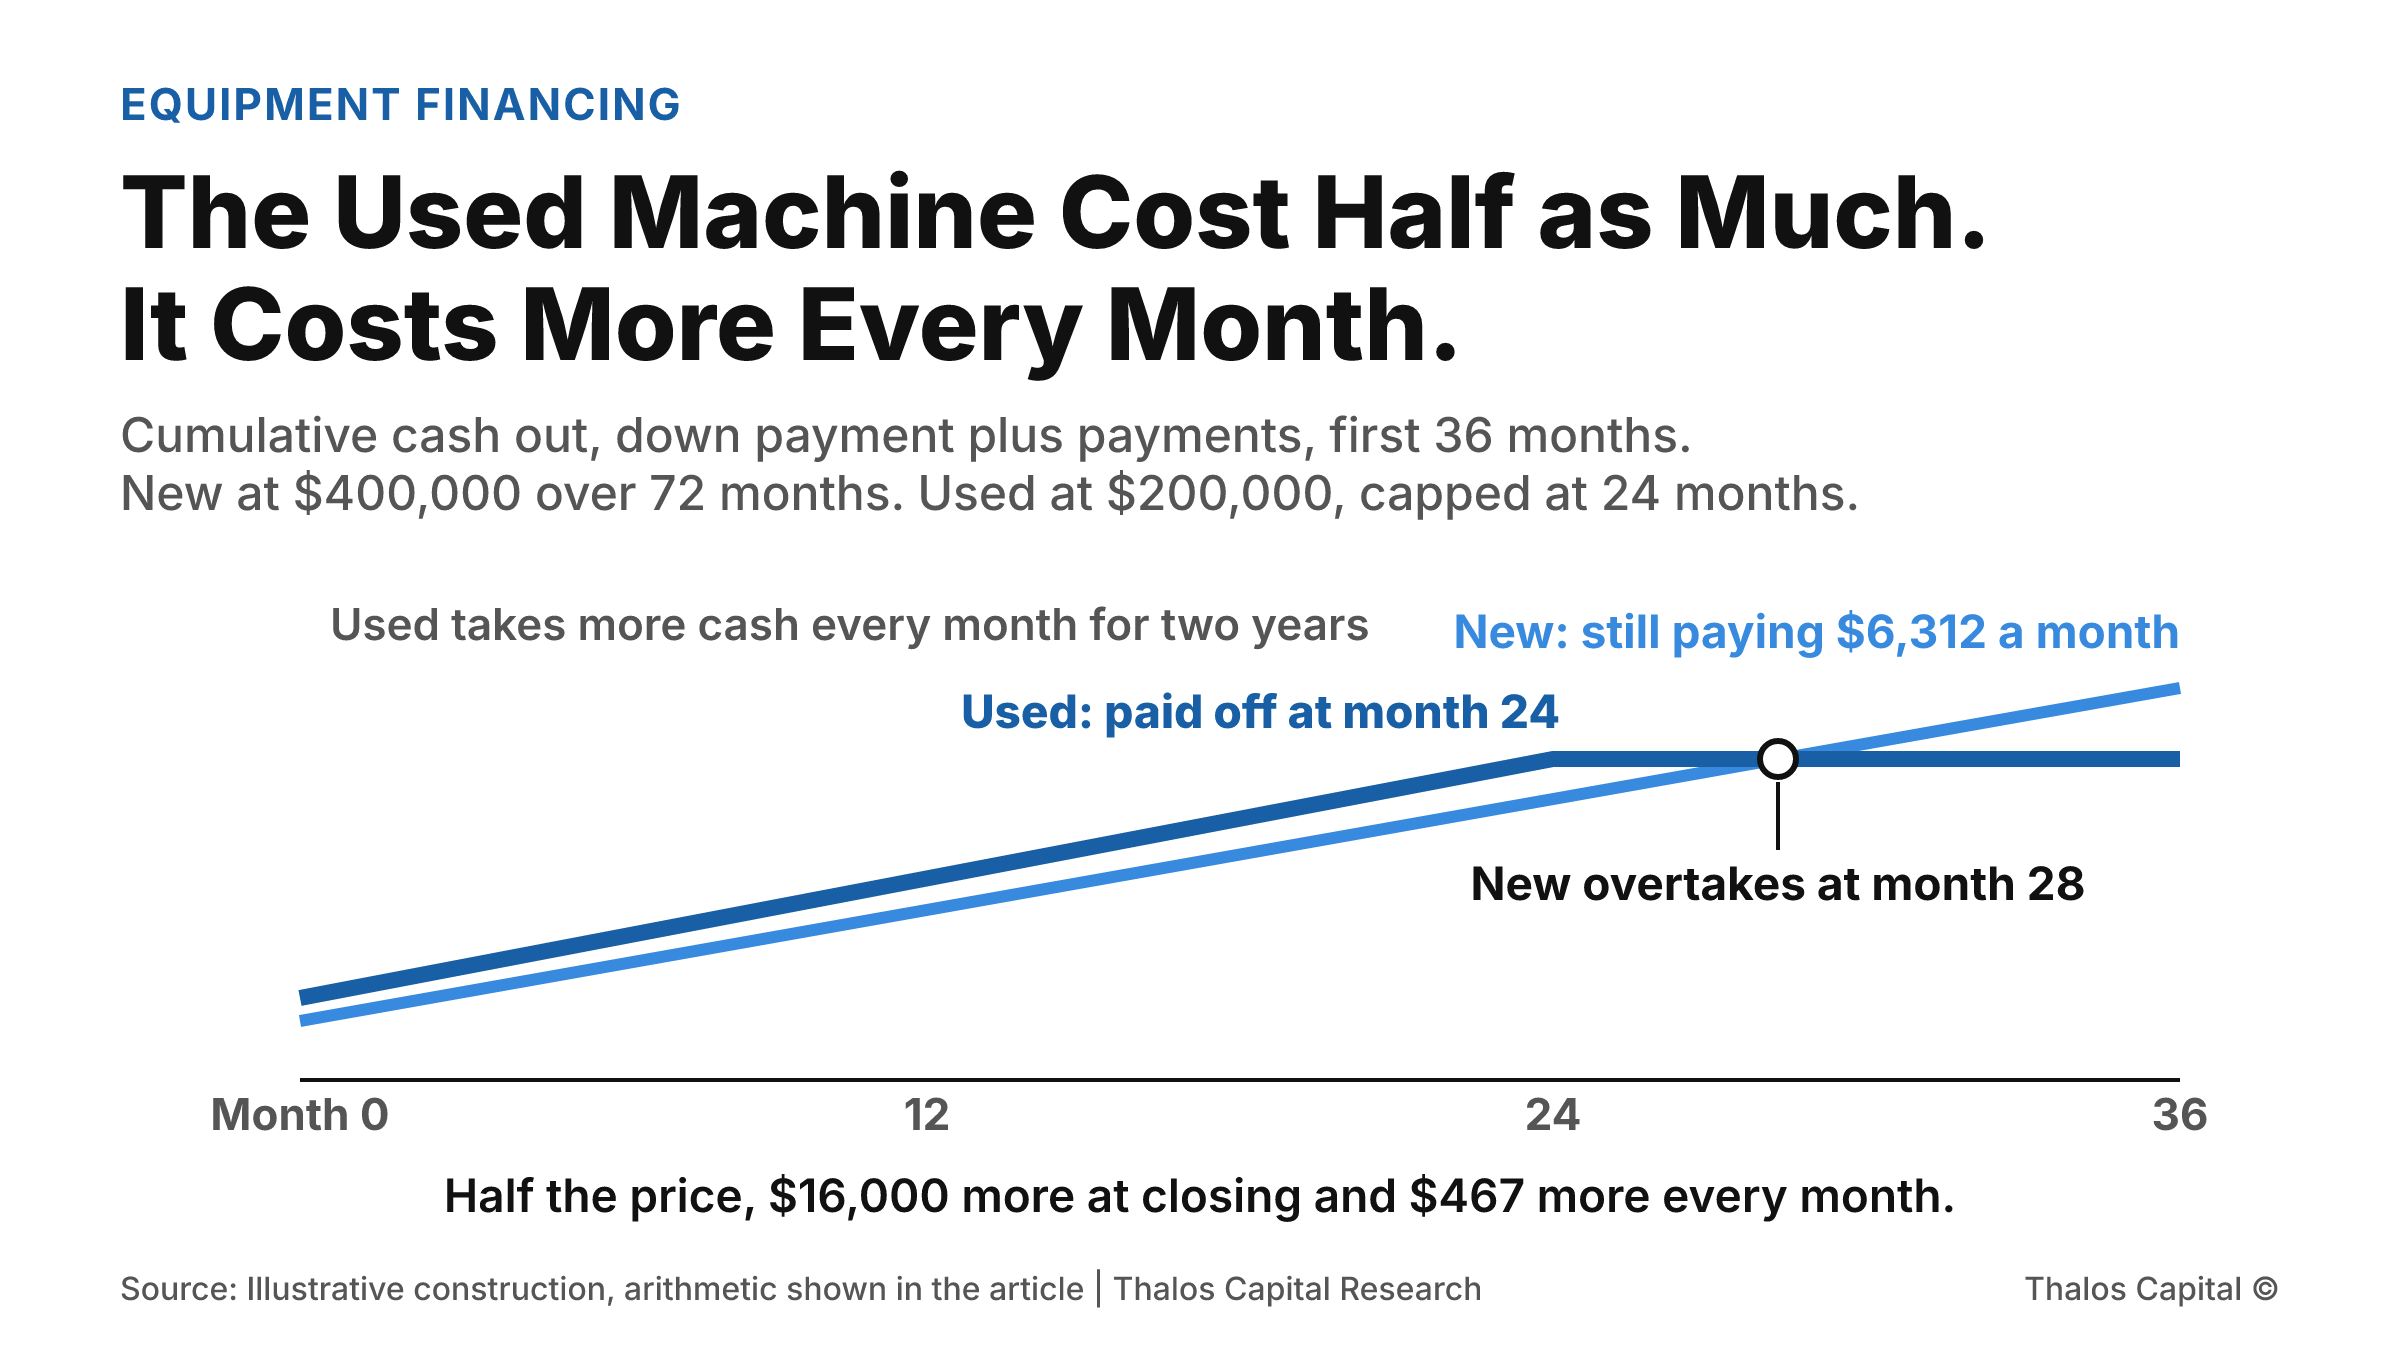
Two lines of cumulative cash out over 36 months. A used excavator at $200,000 takes more cash every month for two years and is paid off at month 24 at $218,686. A new excavator at $400,000 starts lower, overtakes the used machine around month 28, and is still being paid at $6,312 a month.

The Used Machine Cost Half as Much. It Costs More Every Month.

A ten-year-old excavator at half the price of a new one needs $16,000 more at closing and $467 more a month. Older equipment finances on shorter terms against lower appraisals, and the listed price shows neither.
Read More
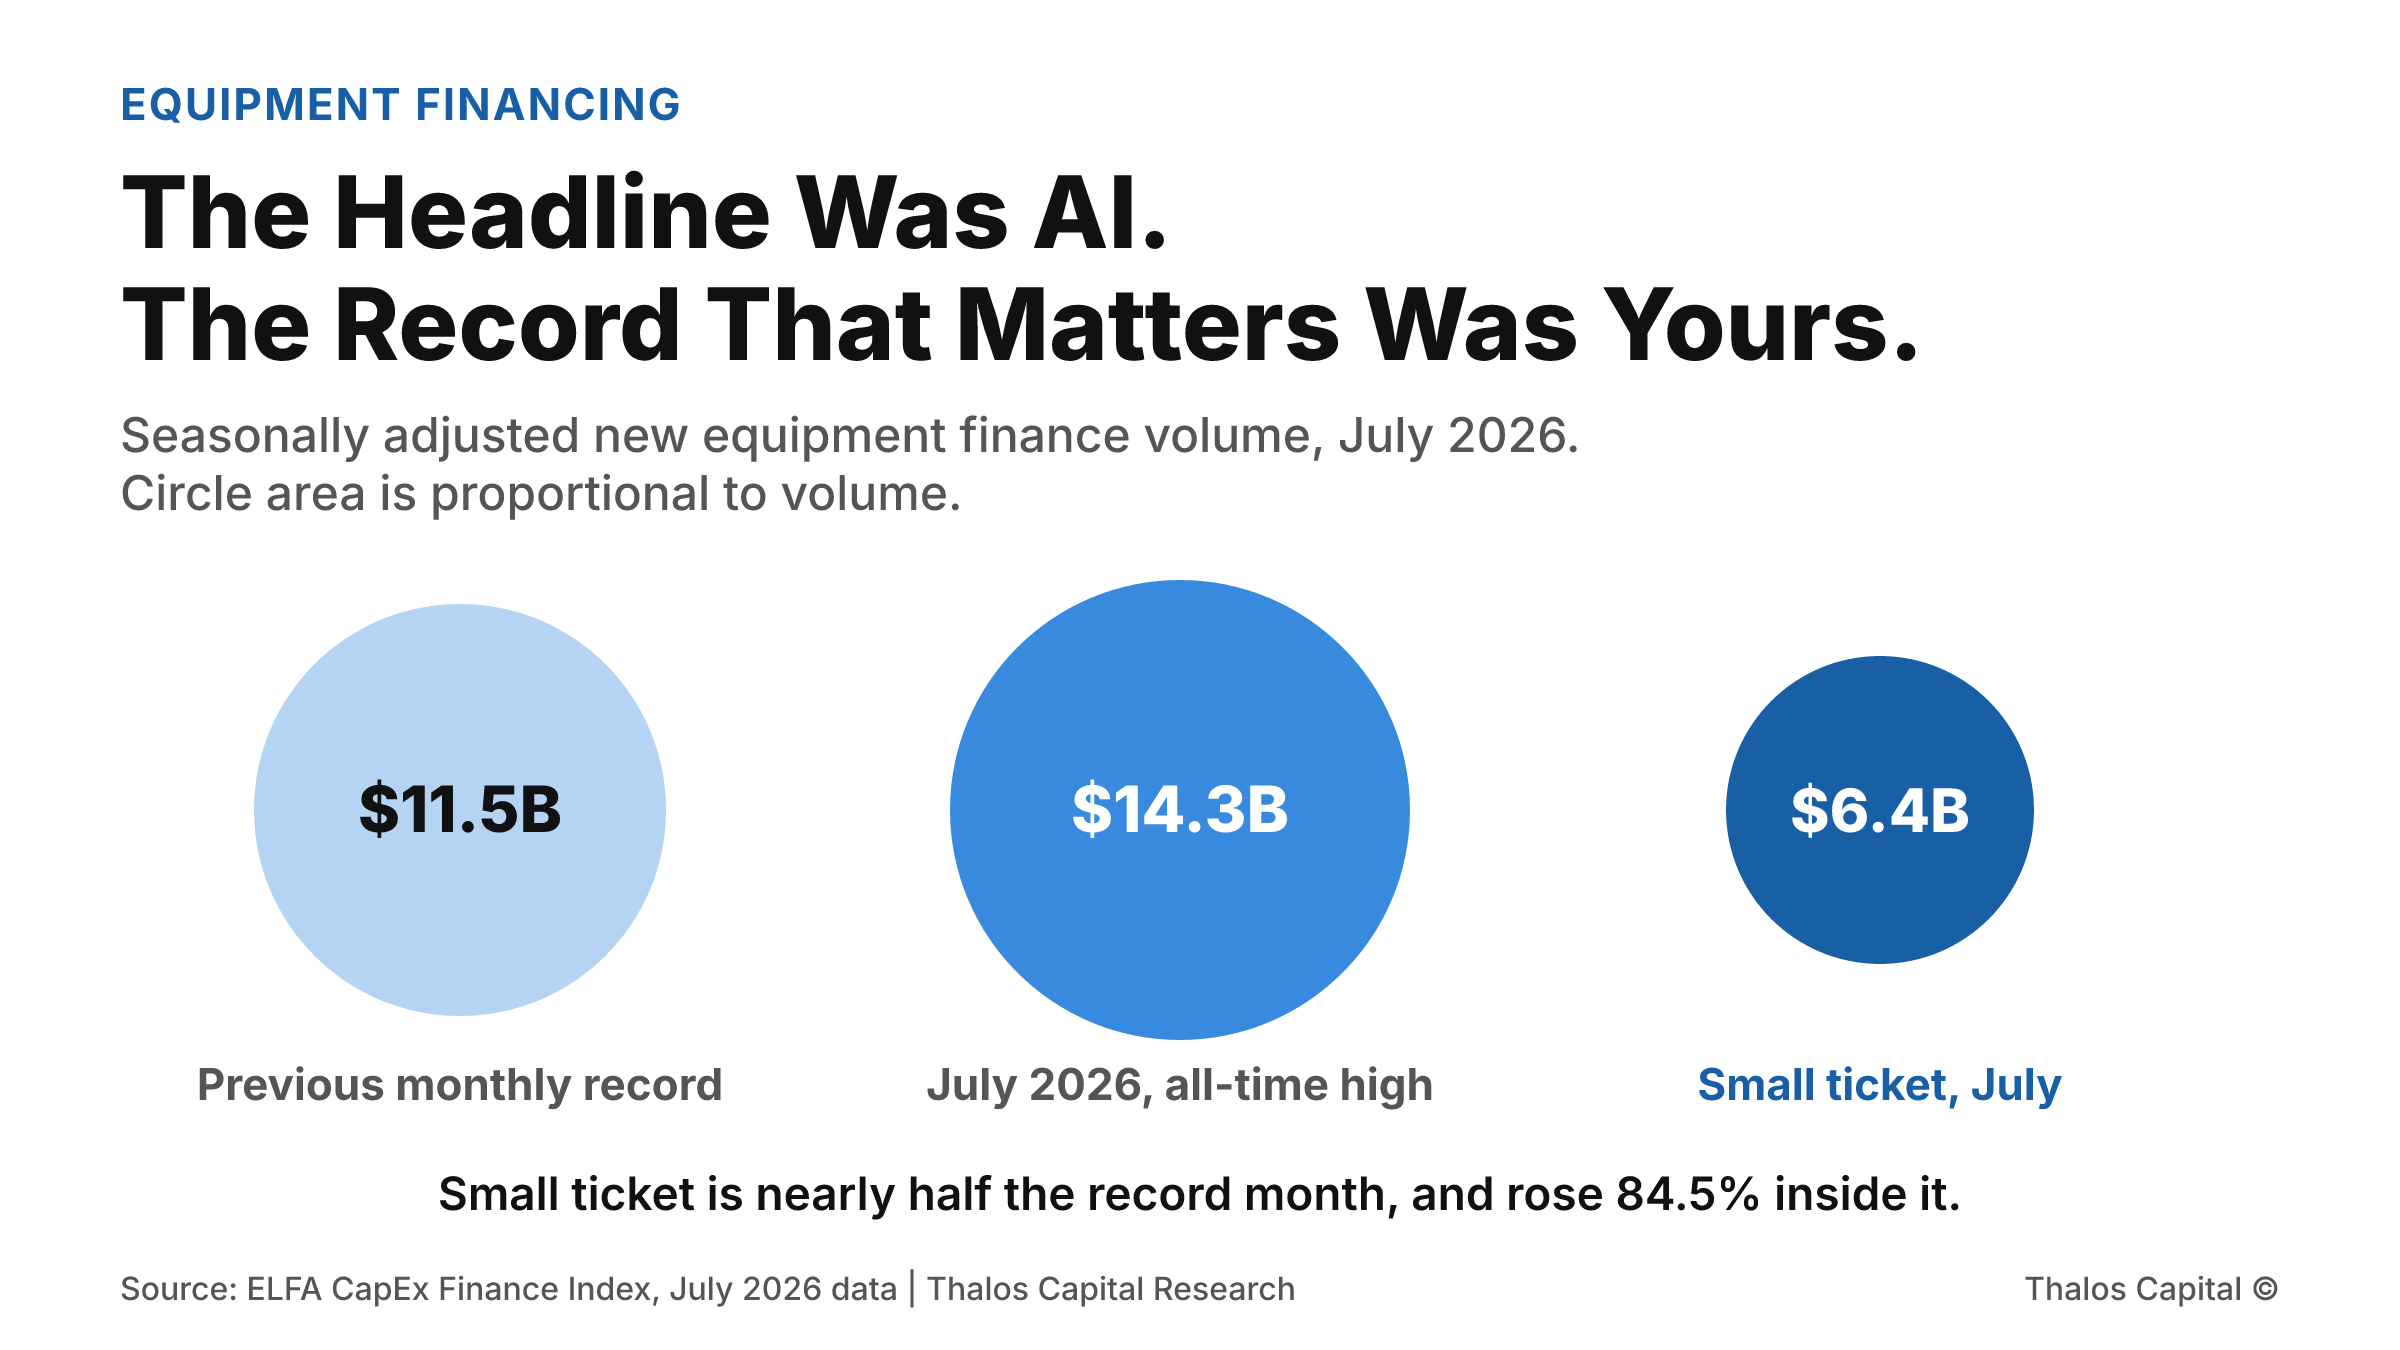
Three proportional circles comparing July 2026 equipment finance volume of $14.3 billion against the previous all-time monthly high of $11.5 billion, with small-ticket volume of $6.4 billion shown as nearly half of the record month.

The Headline Was AI. The Record That Matters Was Yours.

July set an all-time monthly record in equipment finance, and the coverage credited AI capital expenditure. Small-ticket volume set its own record in the same month, up 84.5 percent, and that is the segment mid-market borrowers actually borrow in.
Read More
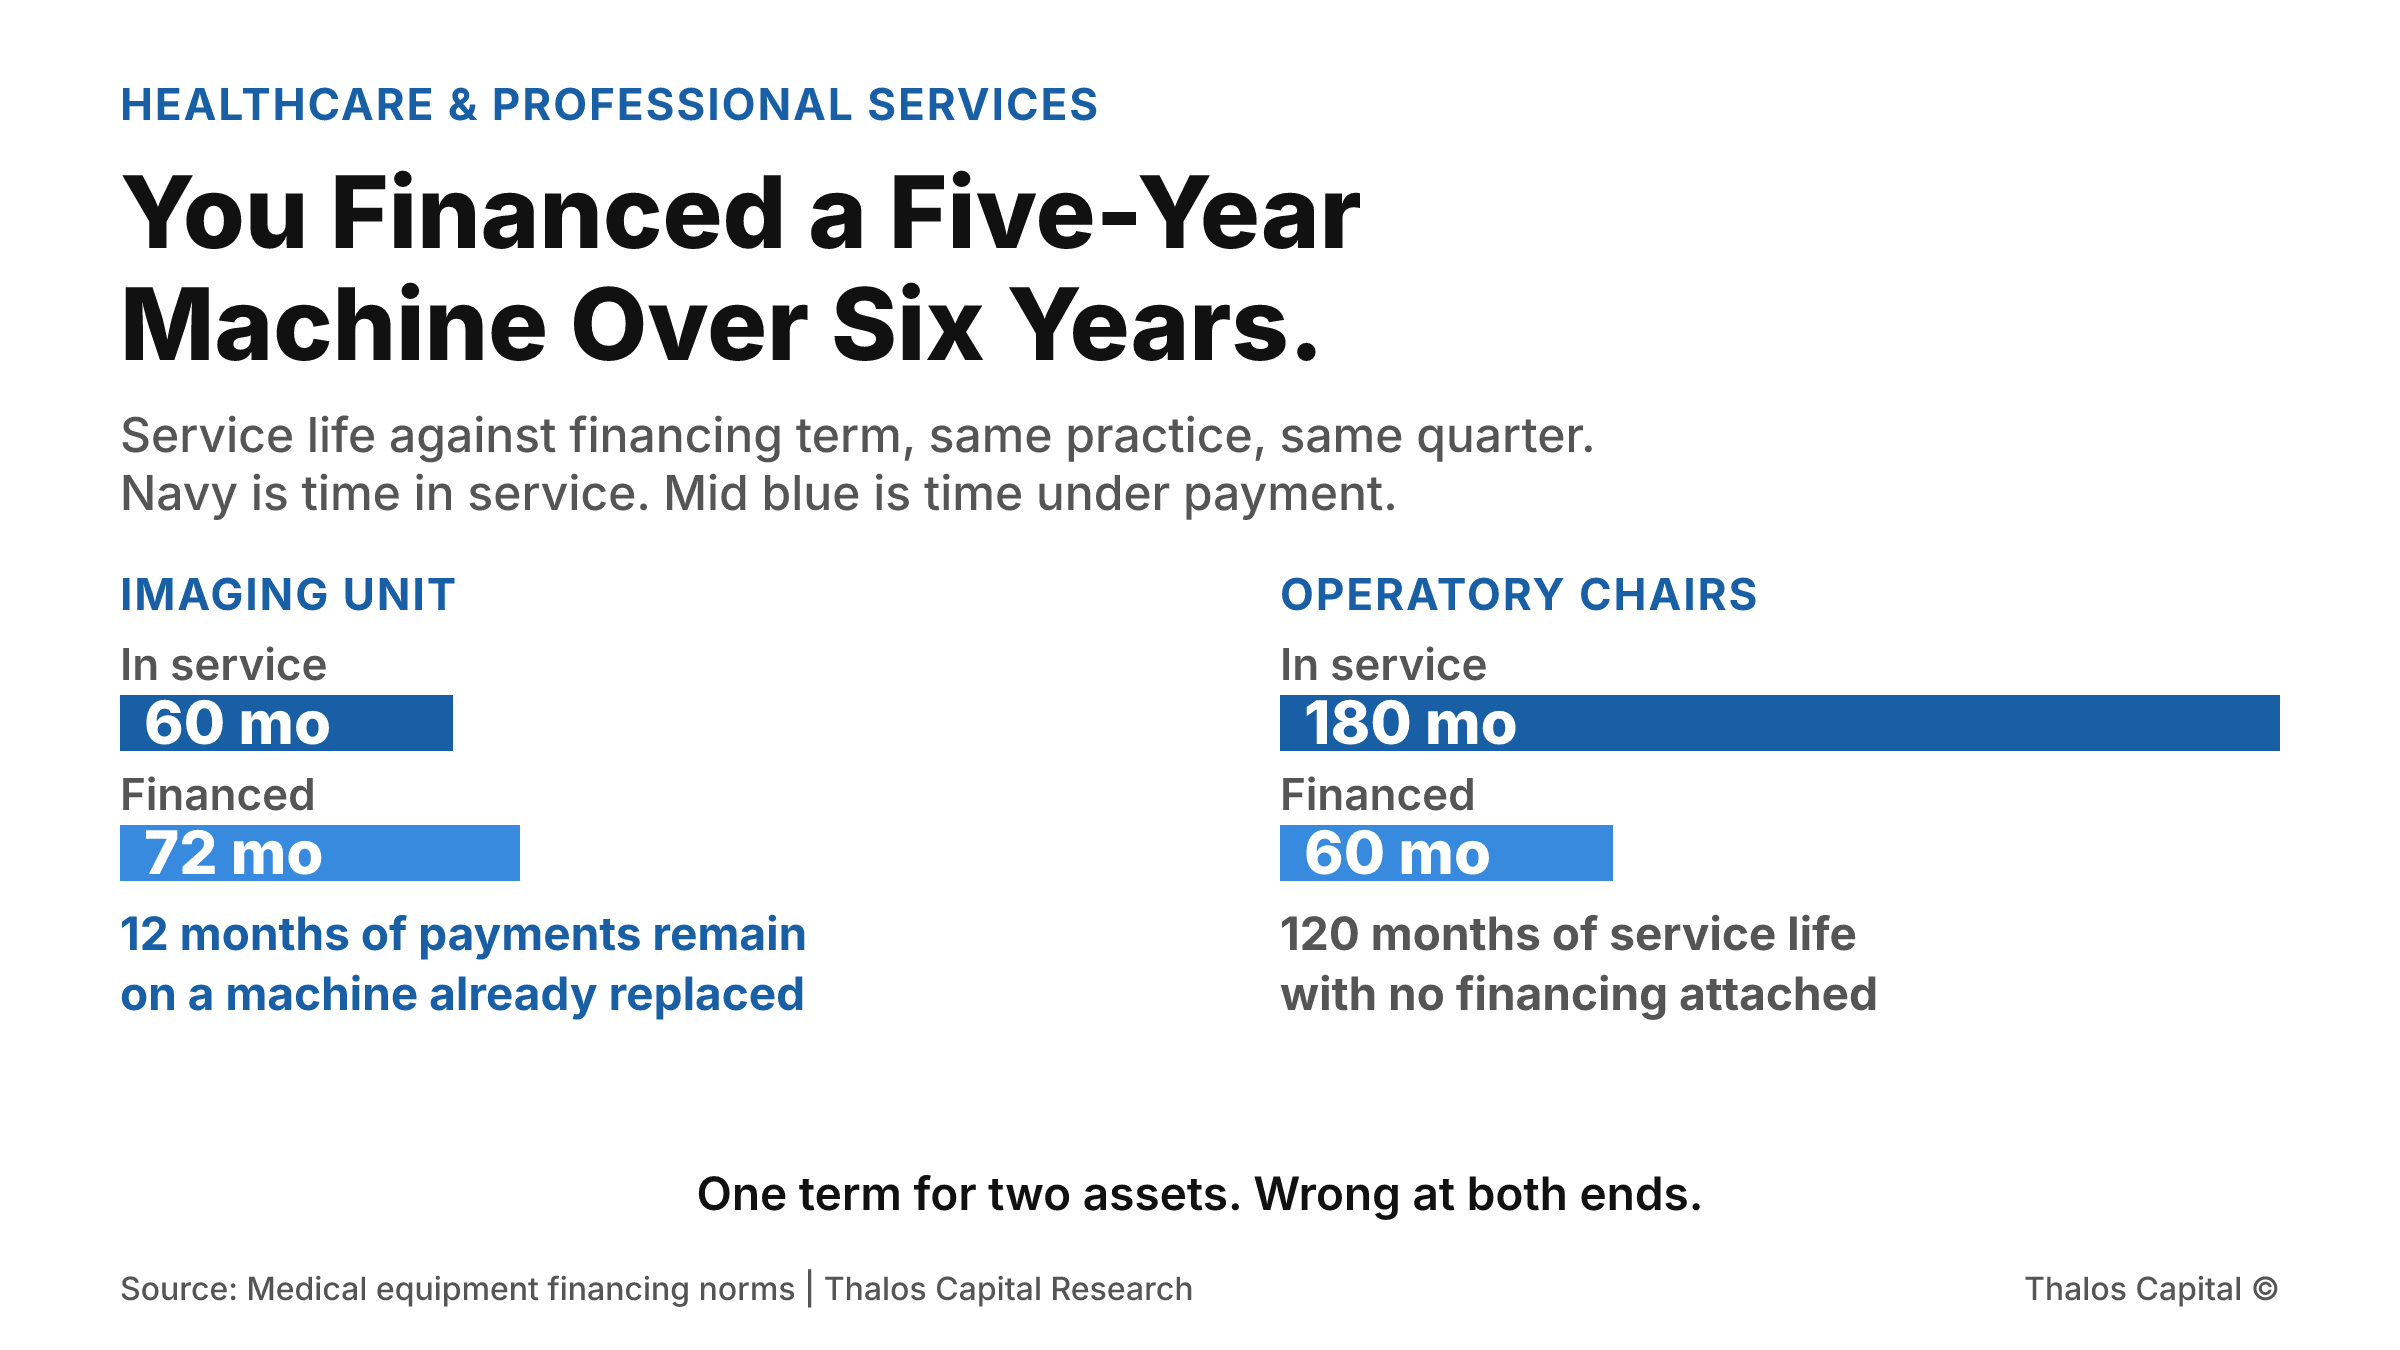
Two panels comparing asset service life against financing term. An imaging unit serves about 60 months but is financed over 72, leaving 12 months of payments on a retired machine. Operatory chairs serve about 180 months but are financed over 60, leaving 120 months of unfinanced life.

You Financed a Five-Year Machine Over Six Years.

A practice buys imaging and operatory chairs in the same quarter. One faces obsolescence in five years, the other runs fifteen. Financing both on a single term loses money at both ends.
Read More
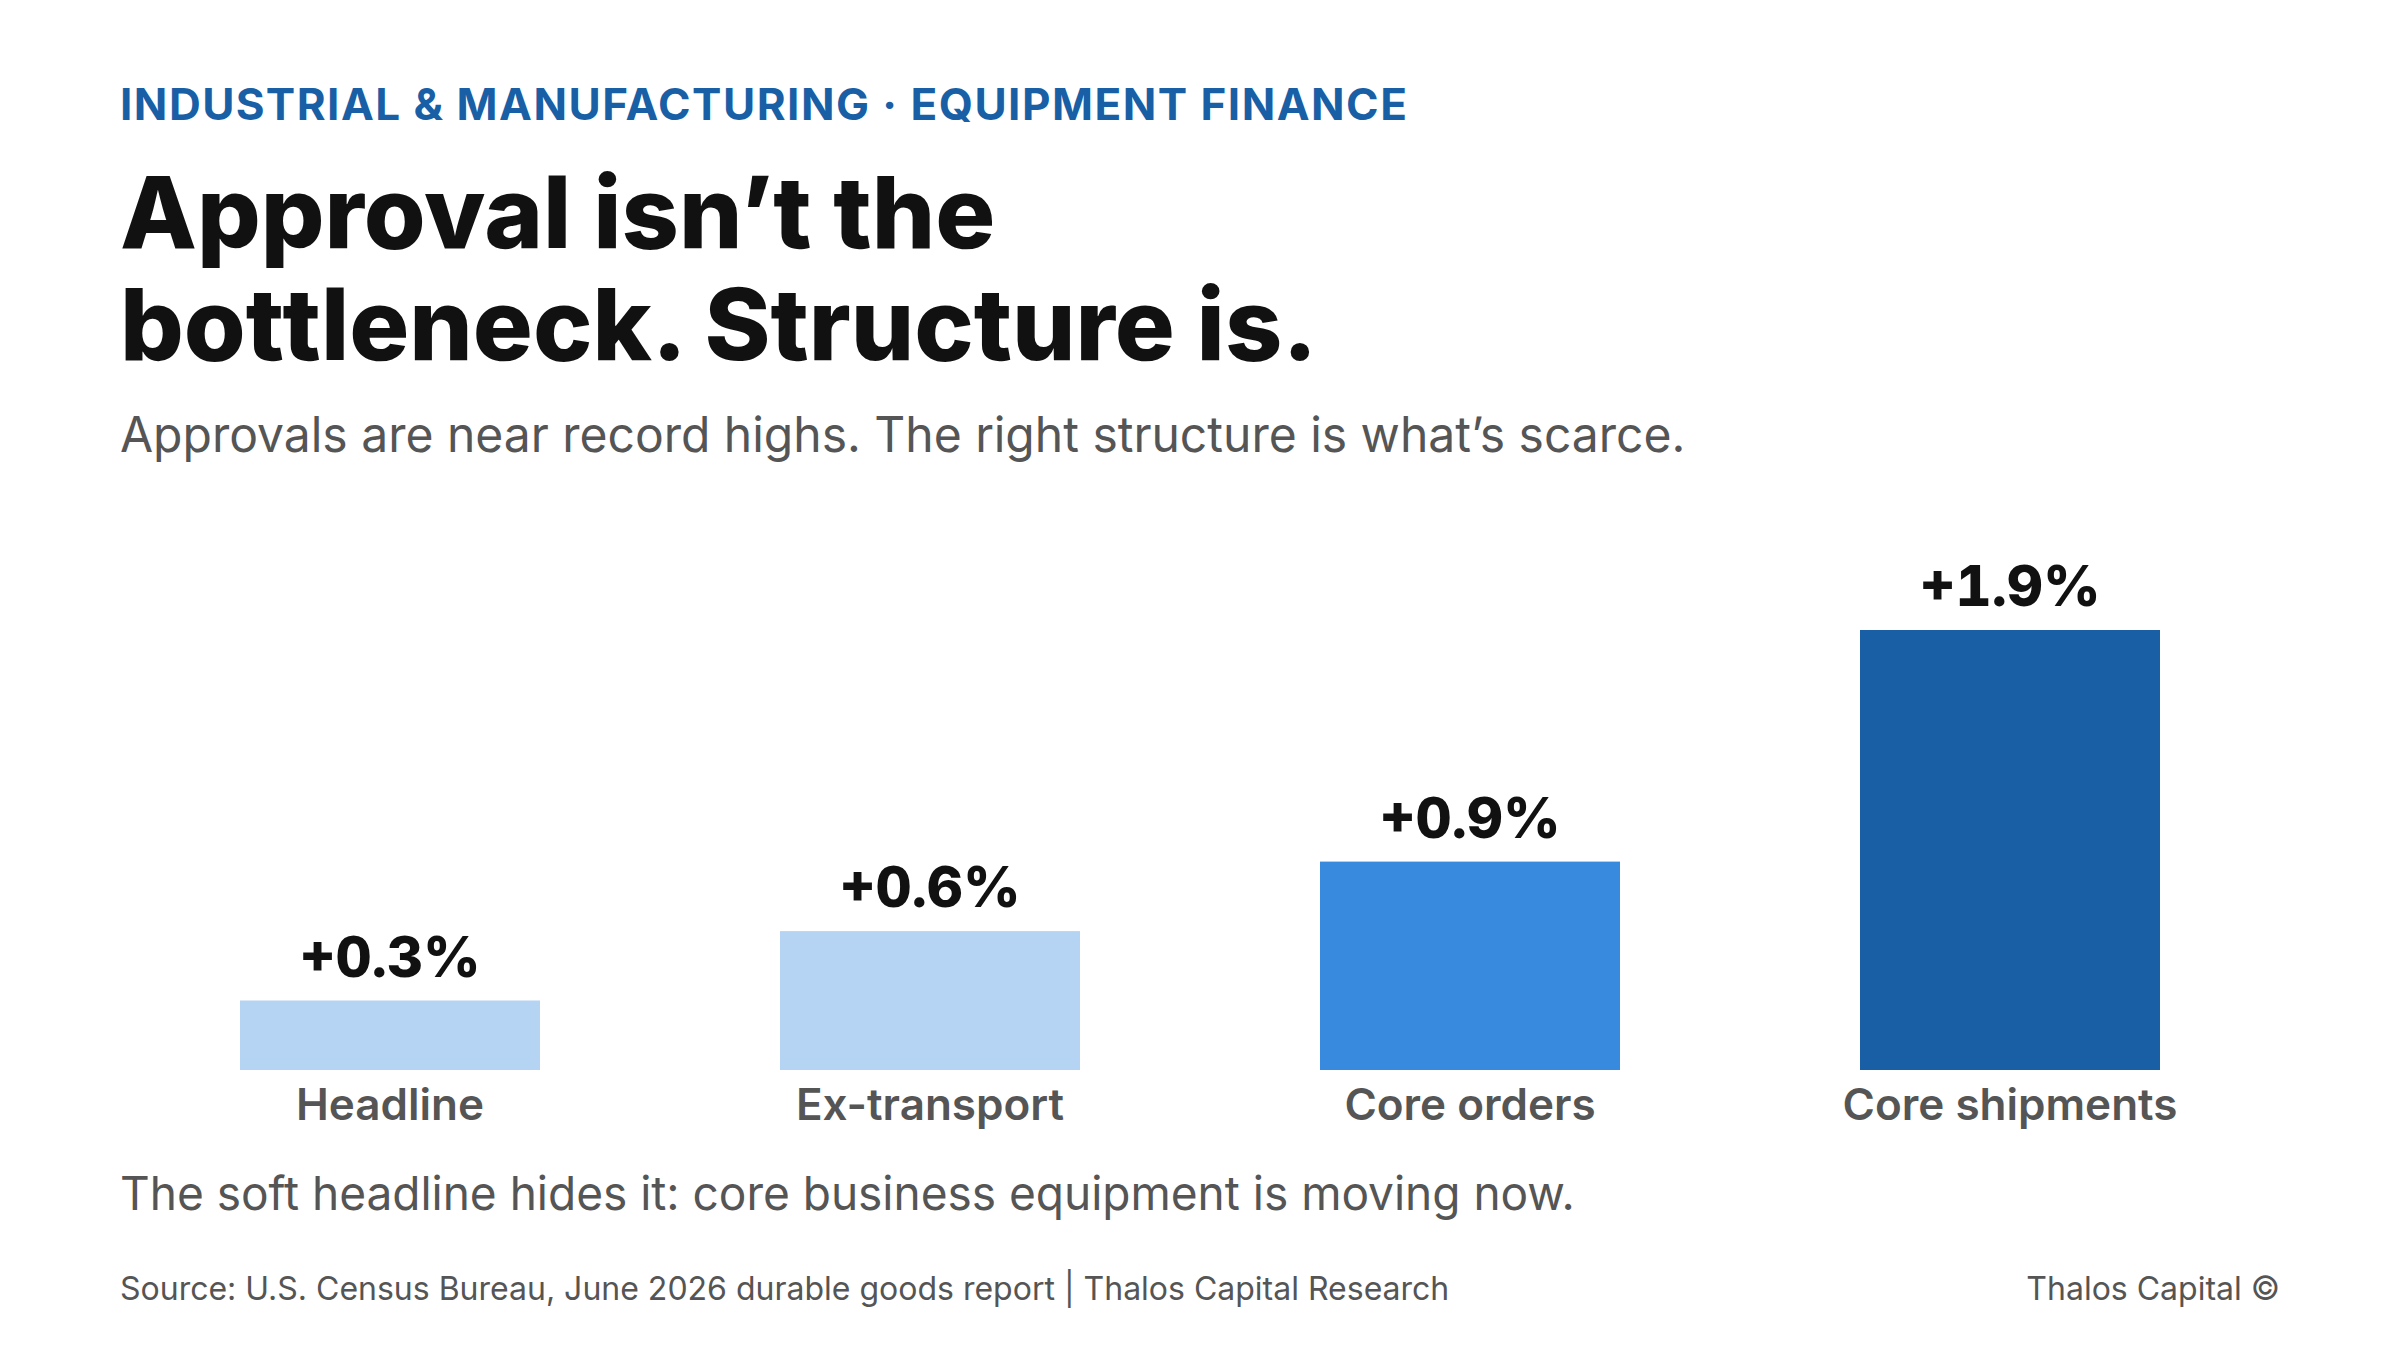
Bar chart of June 2026 durable goods month-over-month change: headline +0.3%, ex-transportation +0.6%, core capital goods orders +0.9%, core capital goods shipments +1.9%, showing strong core business equipment activity.

The Equipment Is Already Shipping. The Financing Decision Should Not Lag It.

Core business-equipment shipments rose 1.9% in June and equipment-finance approvals sit near record highs. For manufacturers, the constraint is no longer approval. It is how the financing is structured against the asset.
Read More
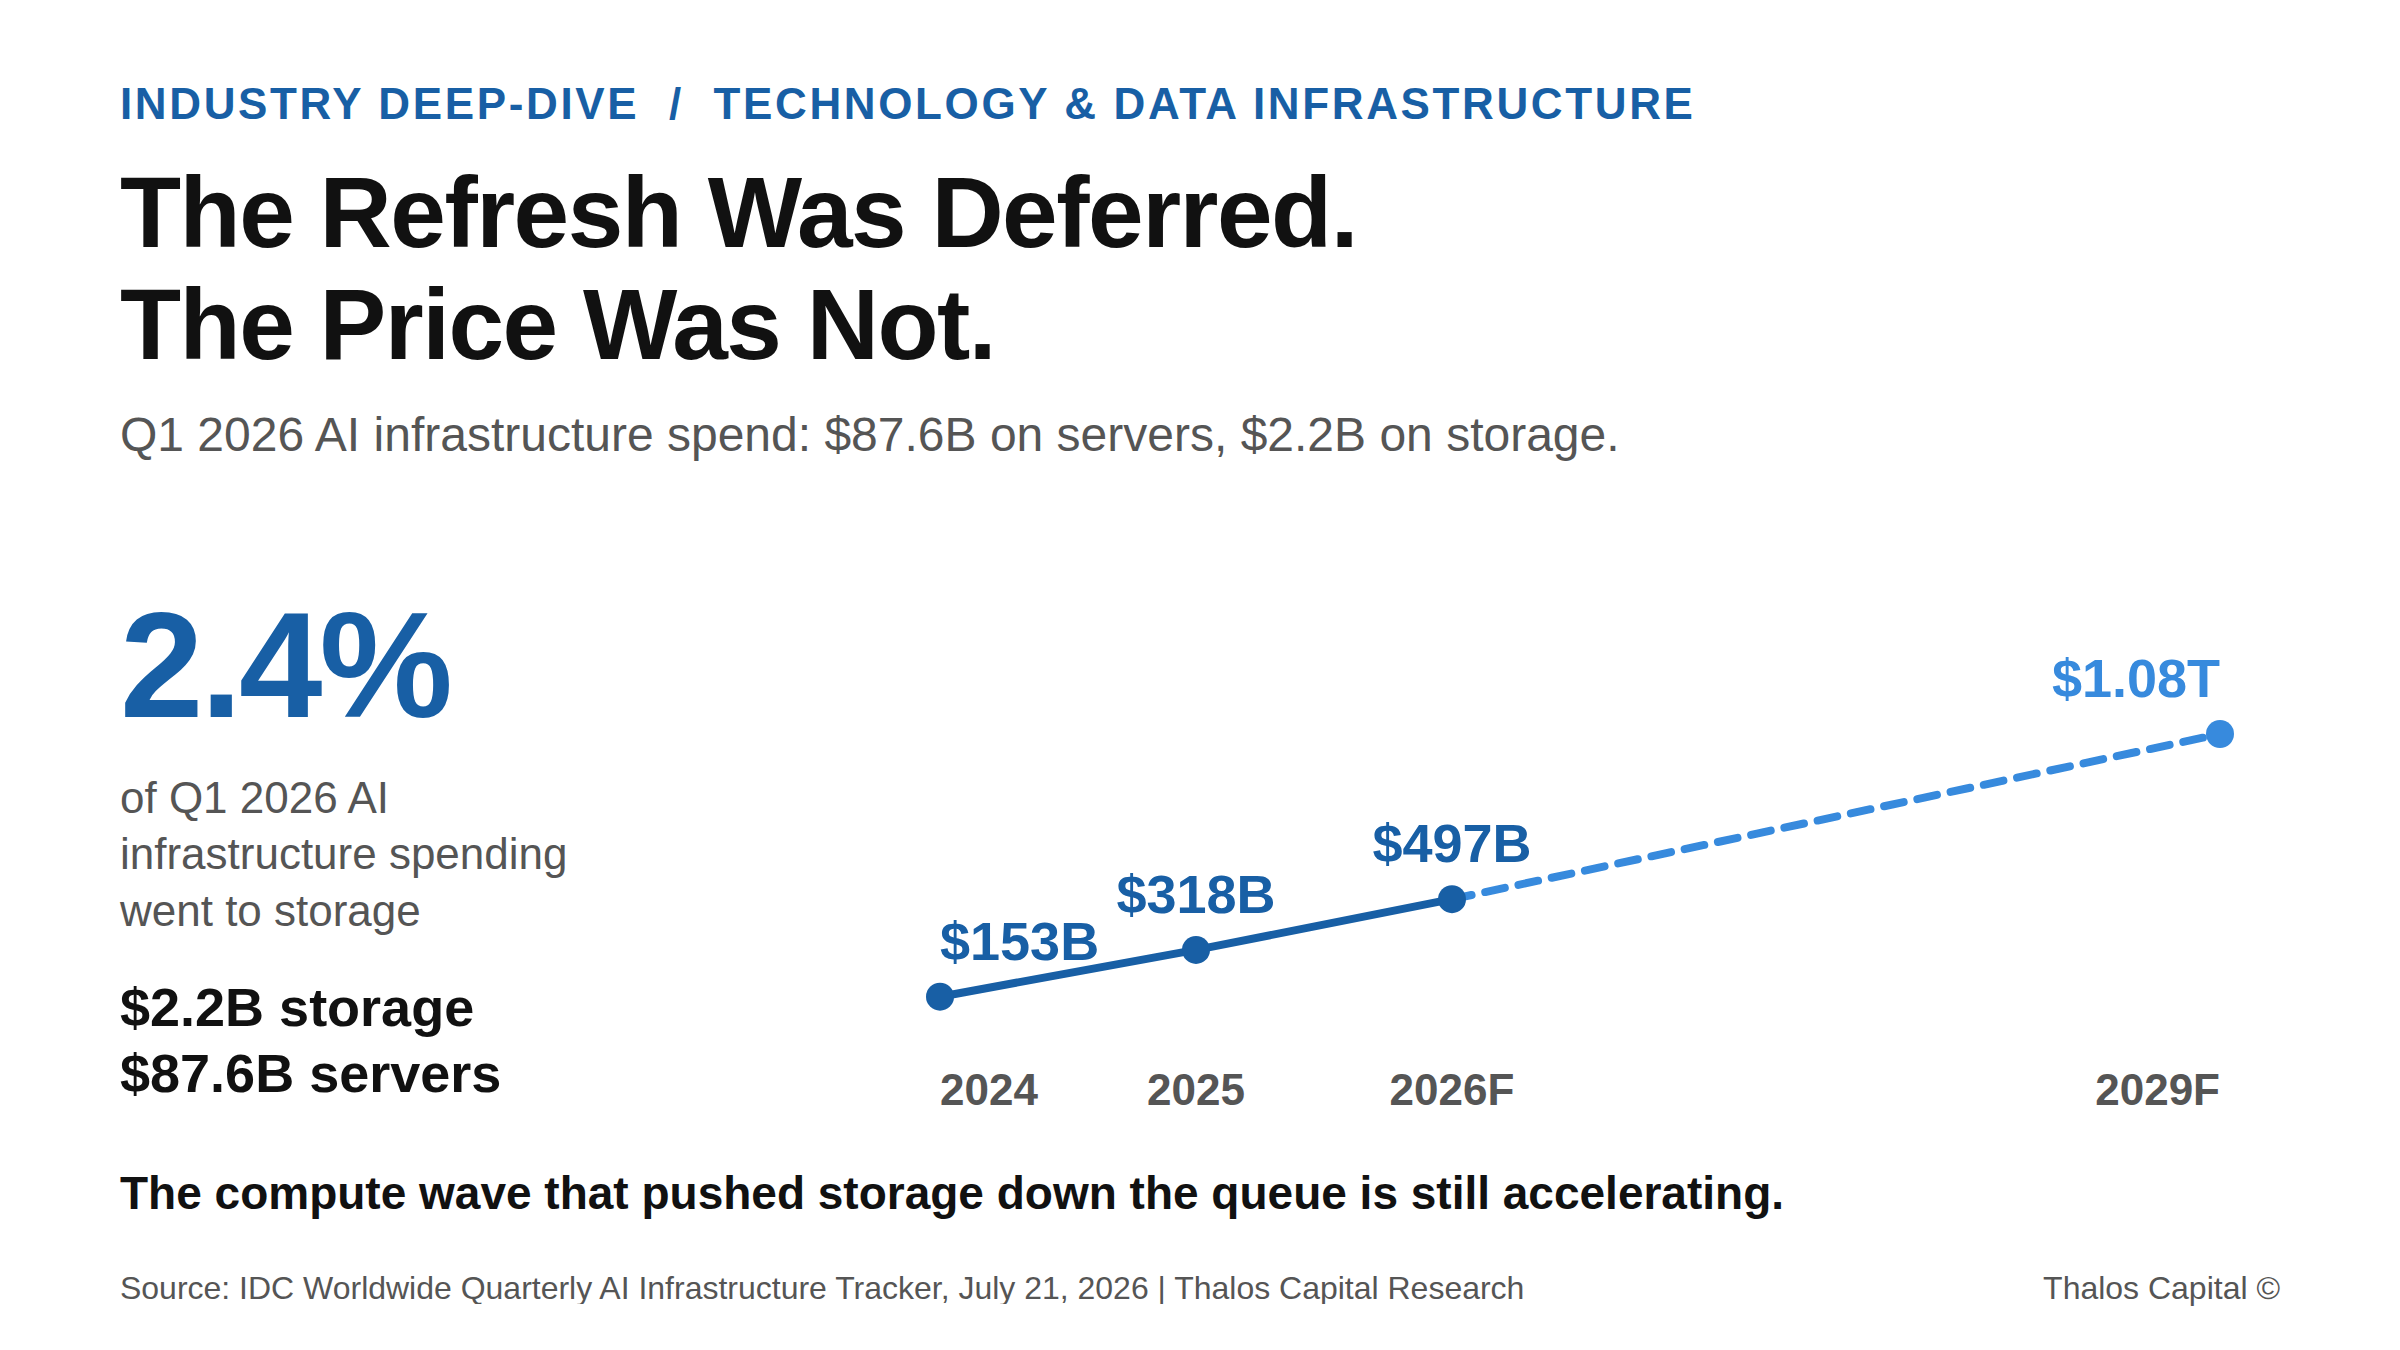
Trend line showing global AI infrastructure spending rising from $153B in 2024 to a forecast $497B in 2026 and $1.08T in 2029, with a callout that storage took 2.4 percent of Q1 2026 spending.

The Storage Refresh You Deferred Comes Due at 2026 Prices

Storage took 2.4% of Q1 2026 AI infrastructure spending. That deferral is expiring into a component market that has repriced every quarter. What it costs, and how to structure the refresh.
Read More
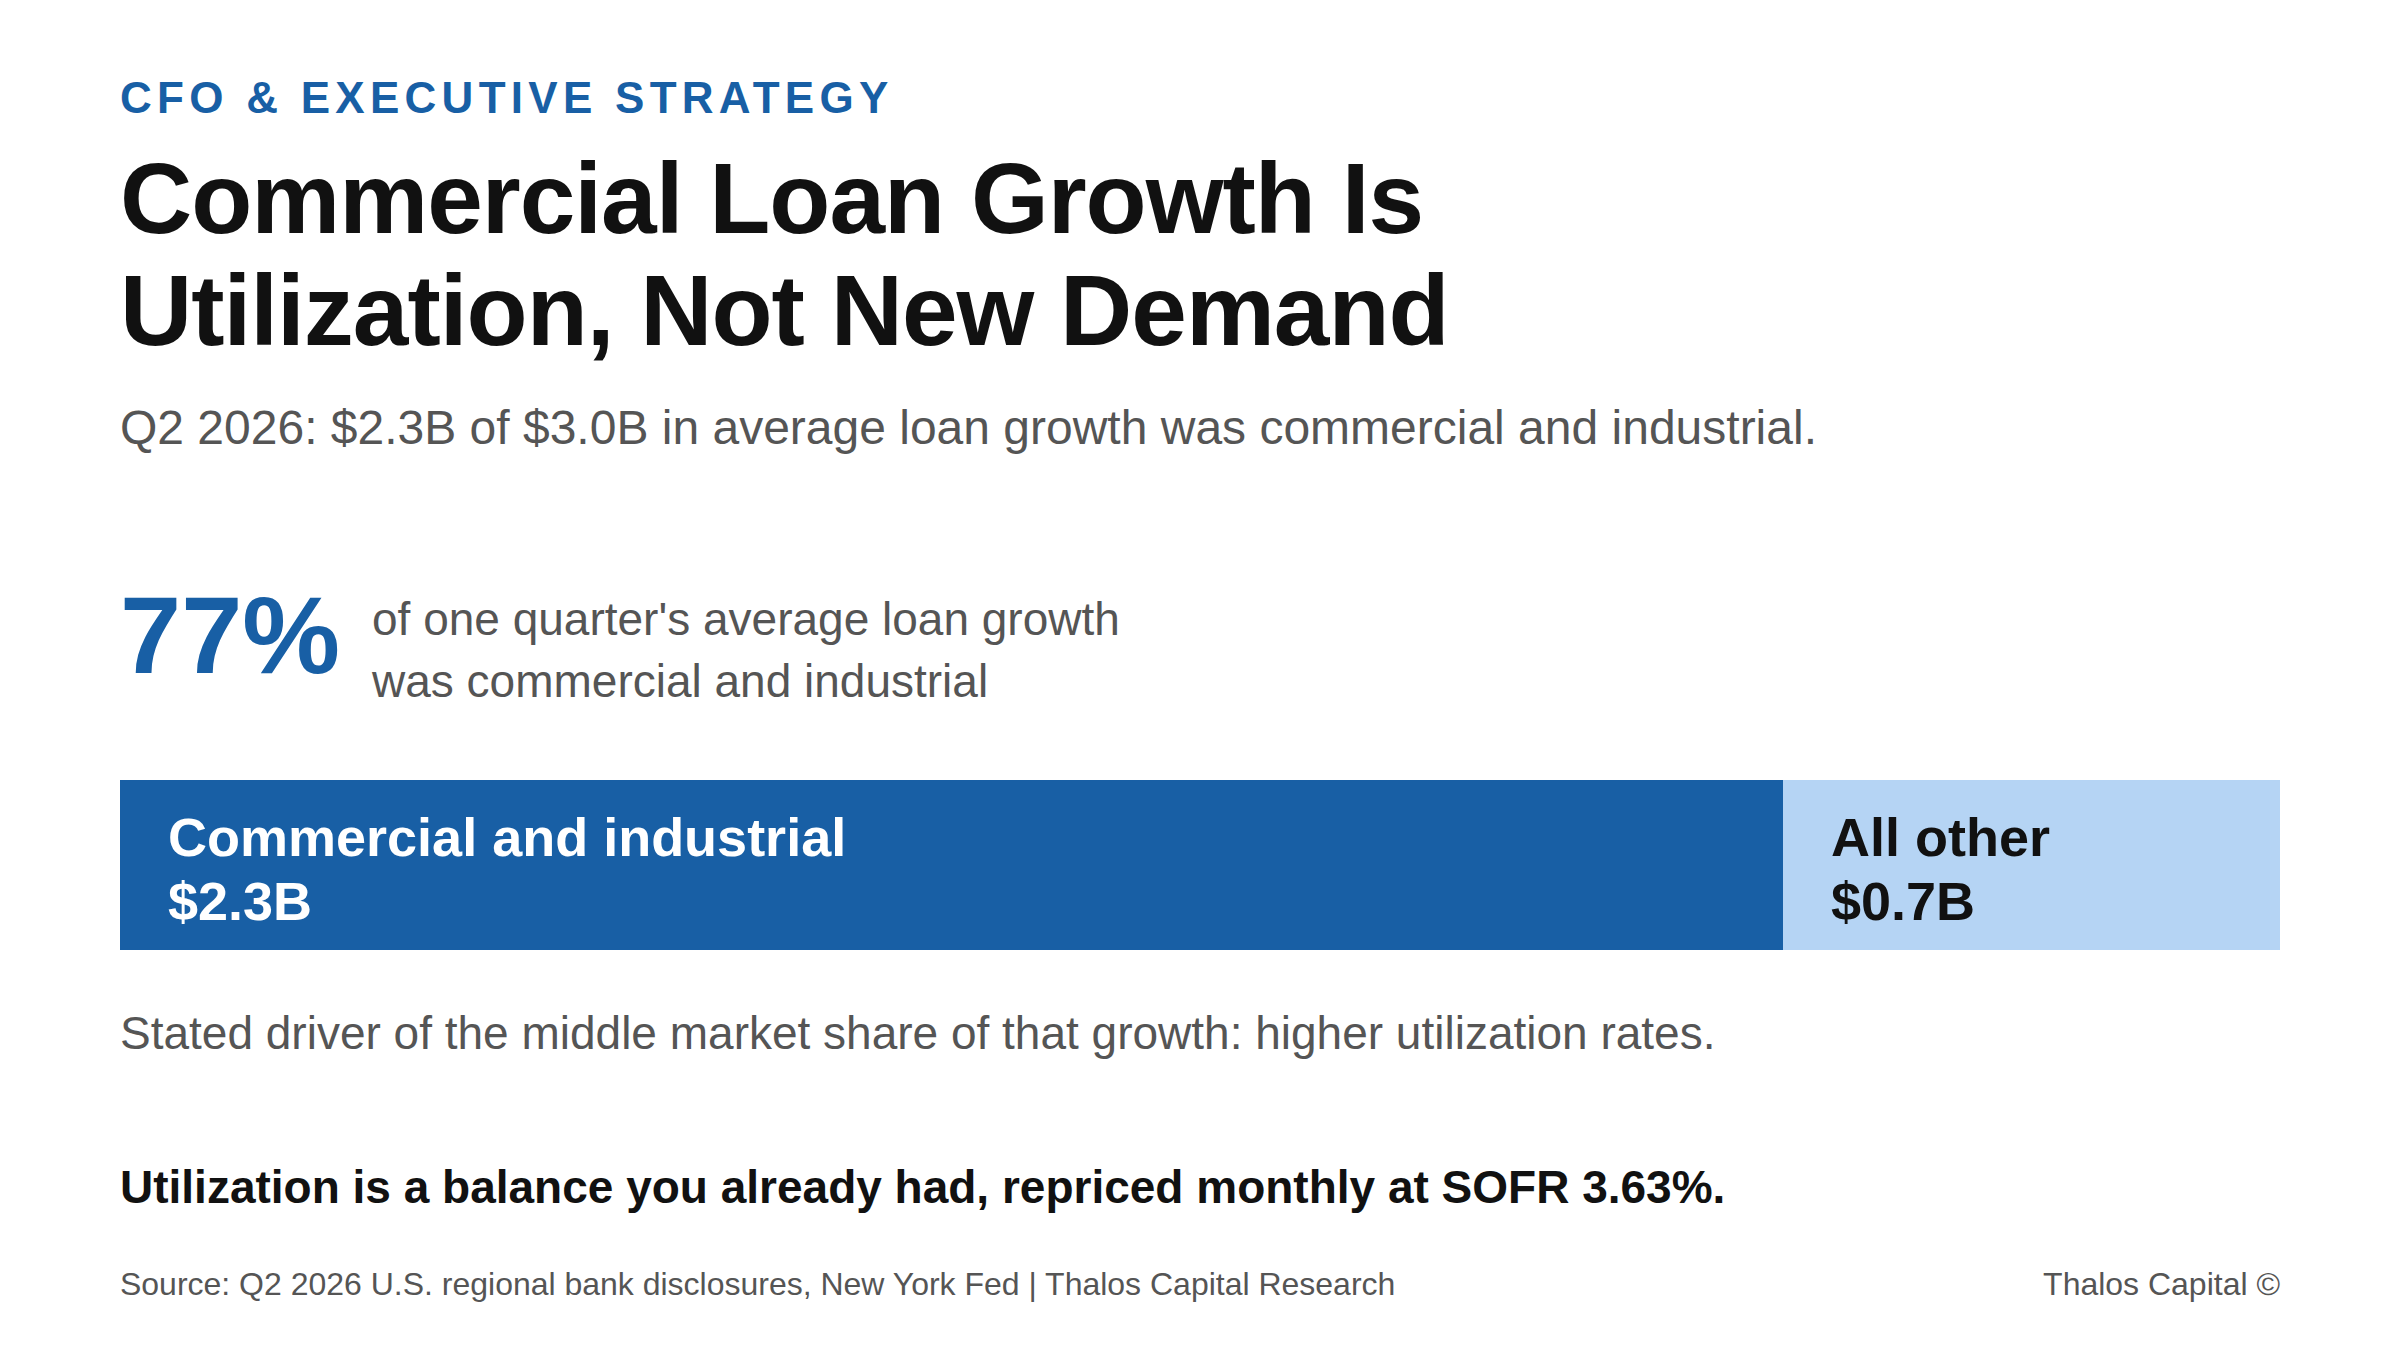
Stacked bar showing $2.3 billion of $3.0 billion in one quarter's average loan growth at a large U.S. regional bank was commercial and industrial, driven by higher utilization rather than new borrowers.

Rising Revolver Utilization Is a Liquidity Signal, Not a Growth Signal

Middle-market commercial balances are rising on higher revolver utilization, not new borrowers. With SOFR at 3.63% and September hike odds at 63%, a drawn line funding permanent assets costs twice.
Read More
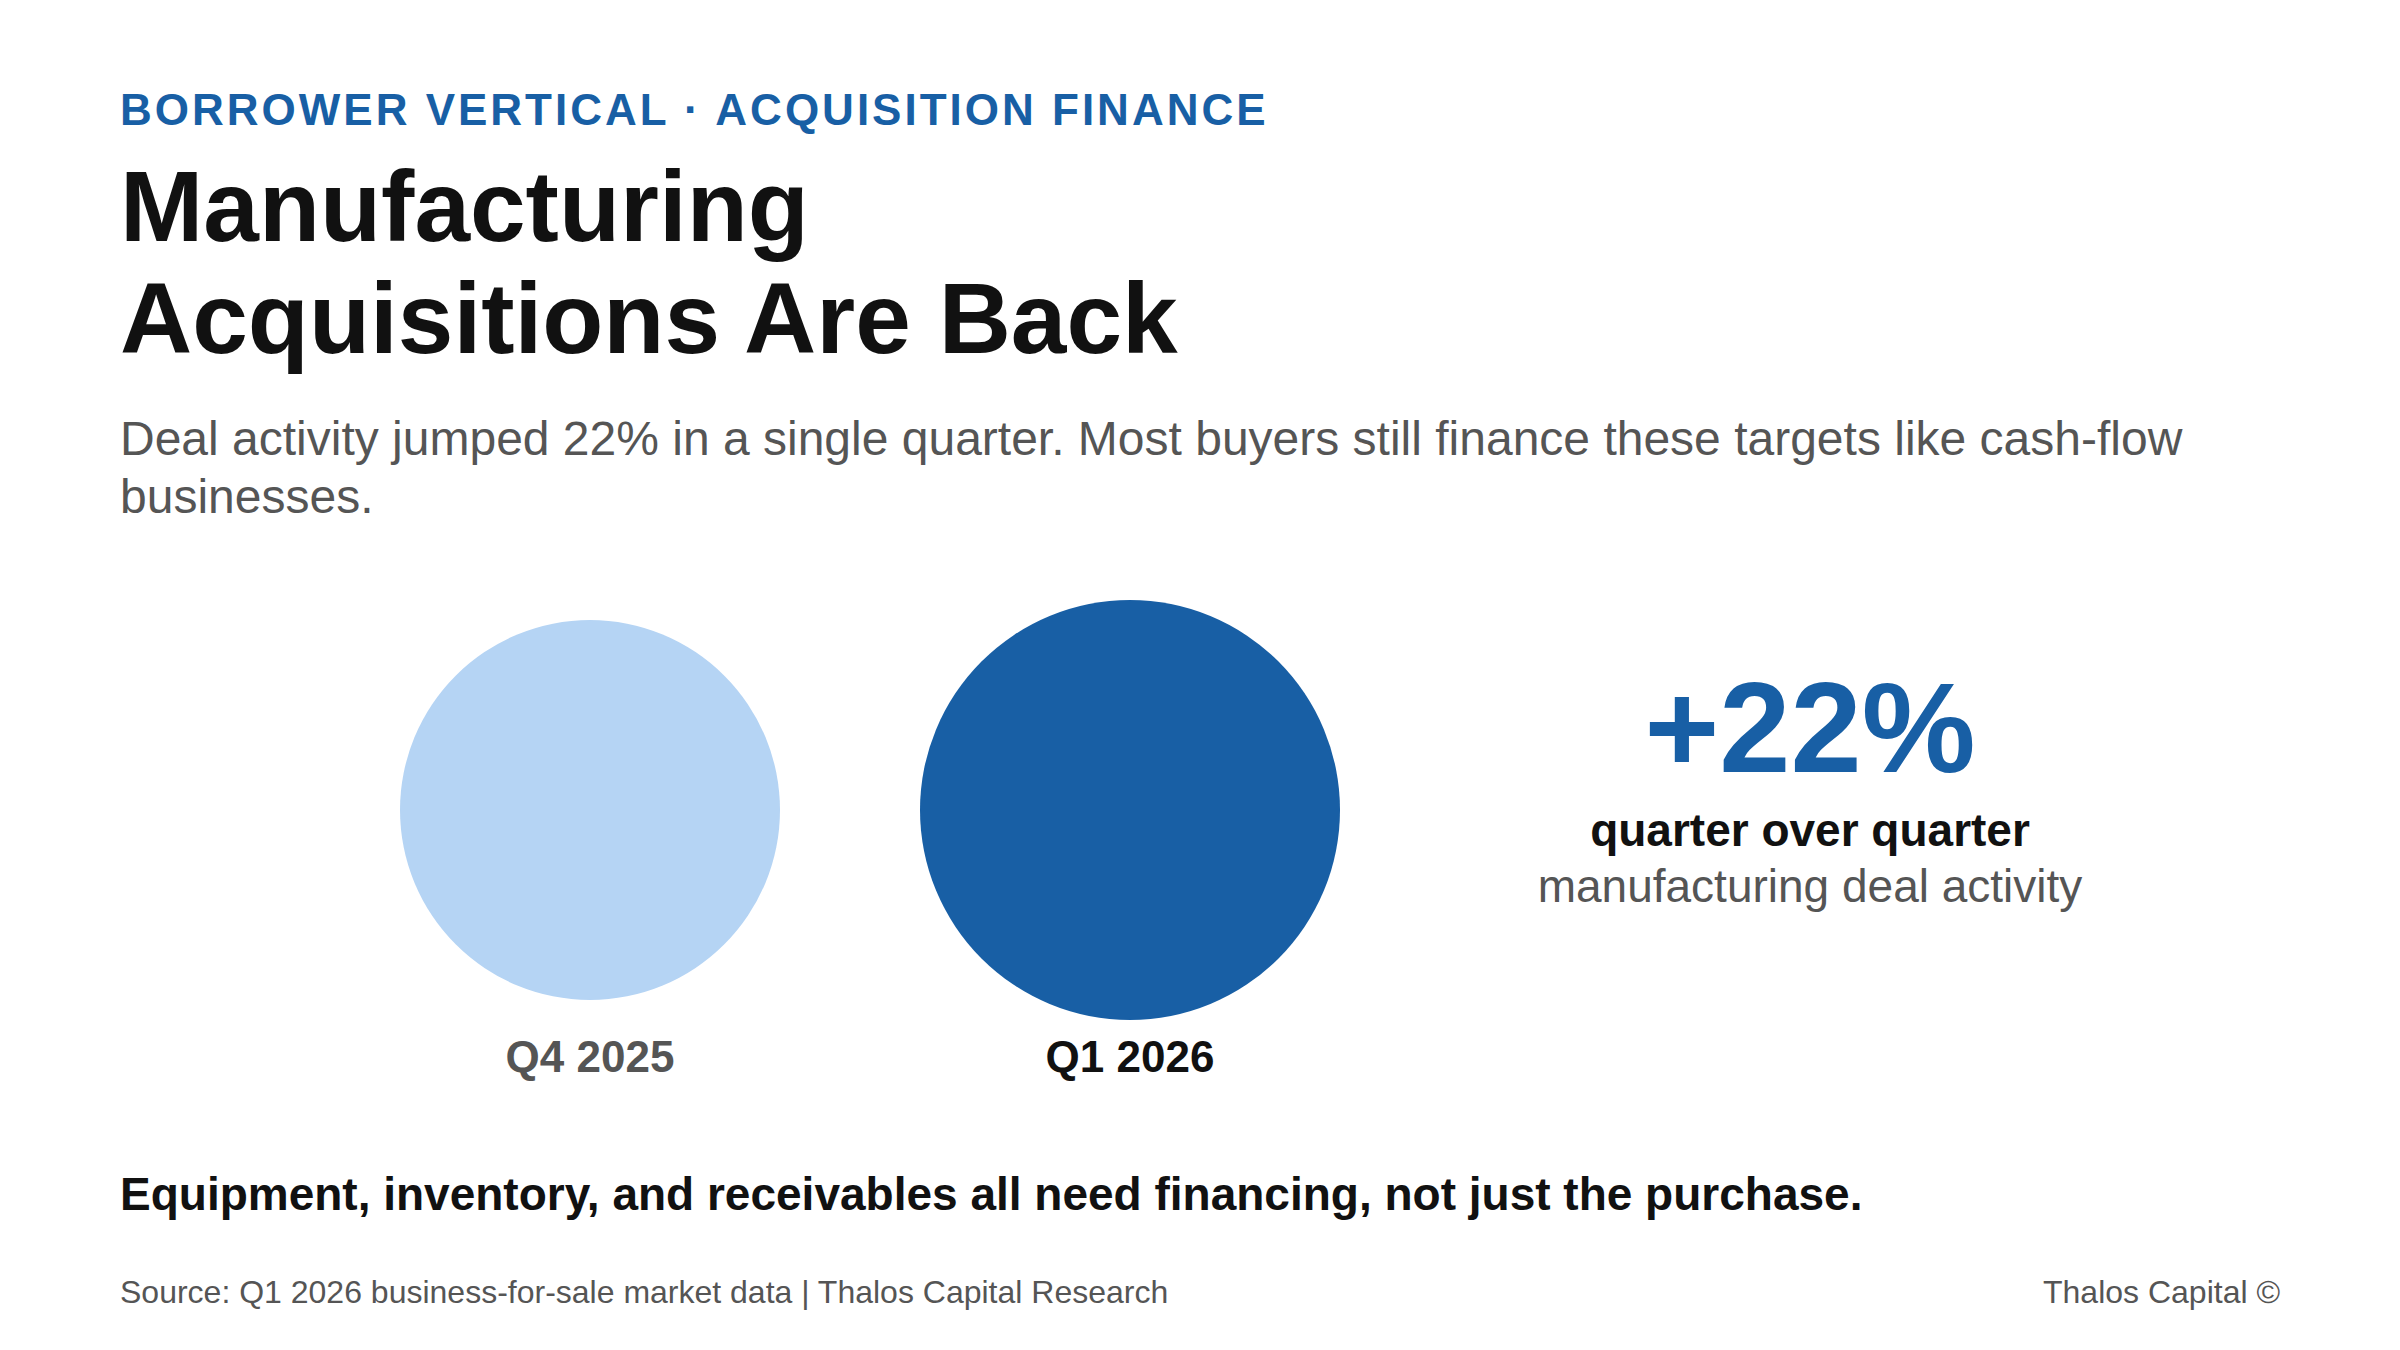
Two proportional circles showing small manufacturing acquisition activity rising 22 percent from Q4 2025 to Q1 2026, with a caption that equipment, inventory, and receivables all need financing, not just the purchase.

Manufacturing Acquisitions Are Back. Financing Them Like a Cash-Flow Buyout Isn't.

Manufacturing acquisitions jumped 22% in Q1 2026, but buyers financing them with a single acquisition loan leave equipment, inventory, and working capital unfunded. Why asset-heavy deals need a blended capital stack.
Read More
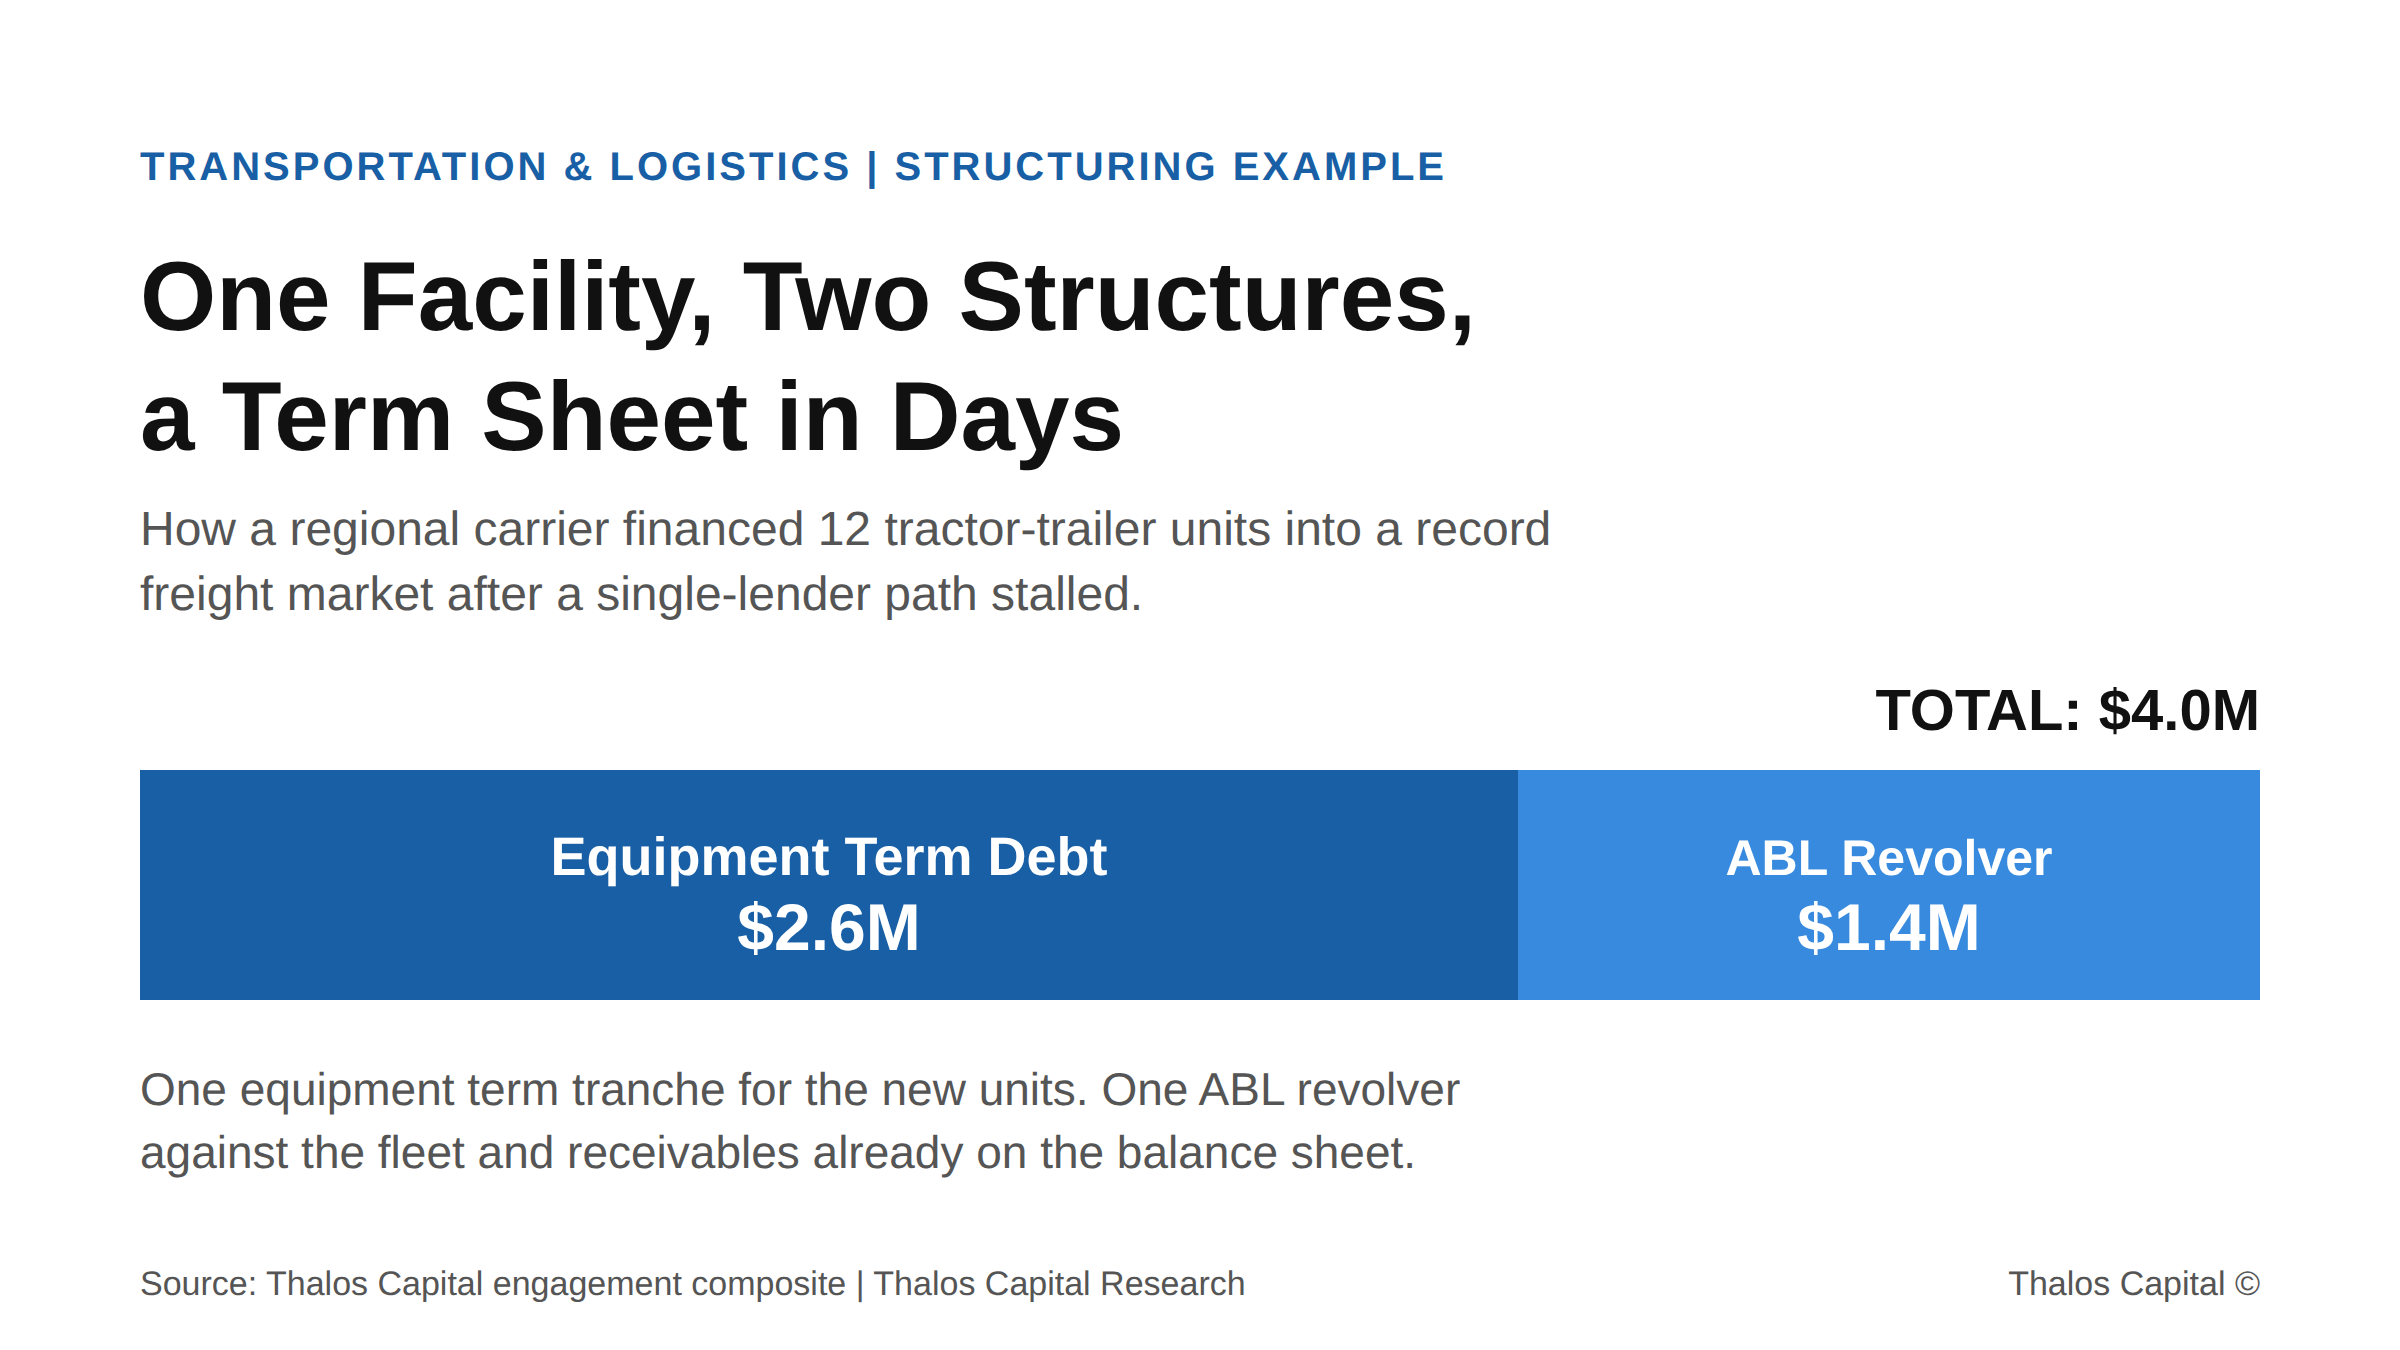
Single stacked bar showing a $4.0 million carrier facility split into a $2.6 million equipment term tranche for 12 tractor-trailer units and a $1.4 million ABL revolver.

How One Regional Carrier Financed Fleet Expansion Into a Record Market After the Bank Said No

US truckload spot rates hit a record $3.83 per mile, but recession-scarred balance sheets stall bank-only expansion. How one carrier structured $4.0M to add trucks in days.
Read More
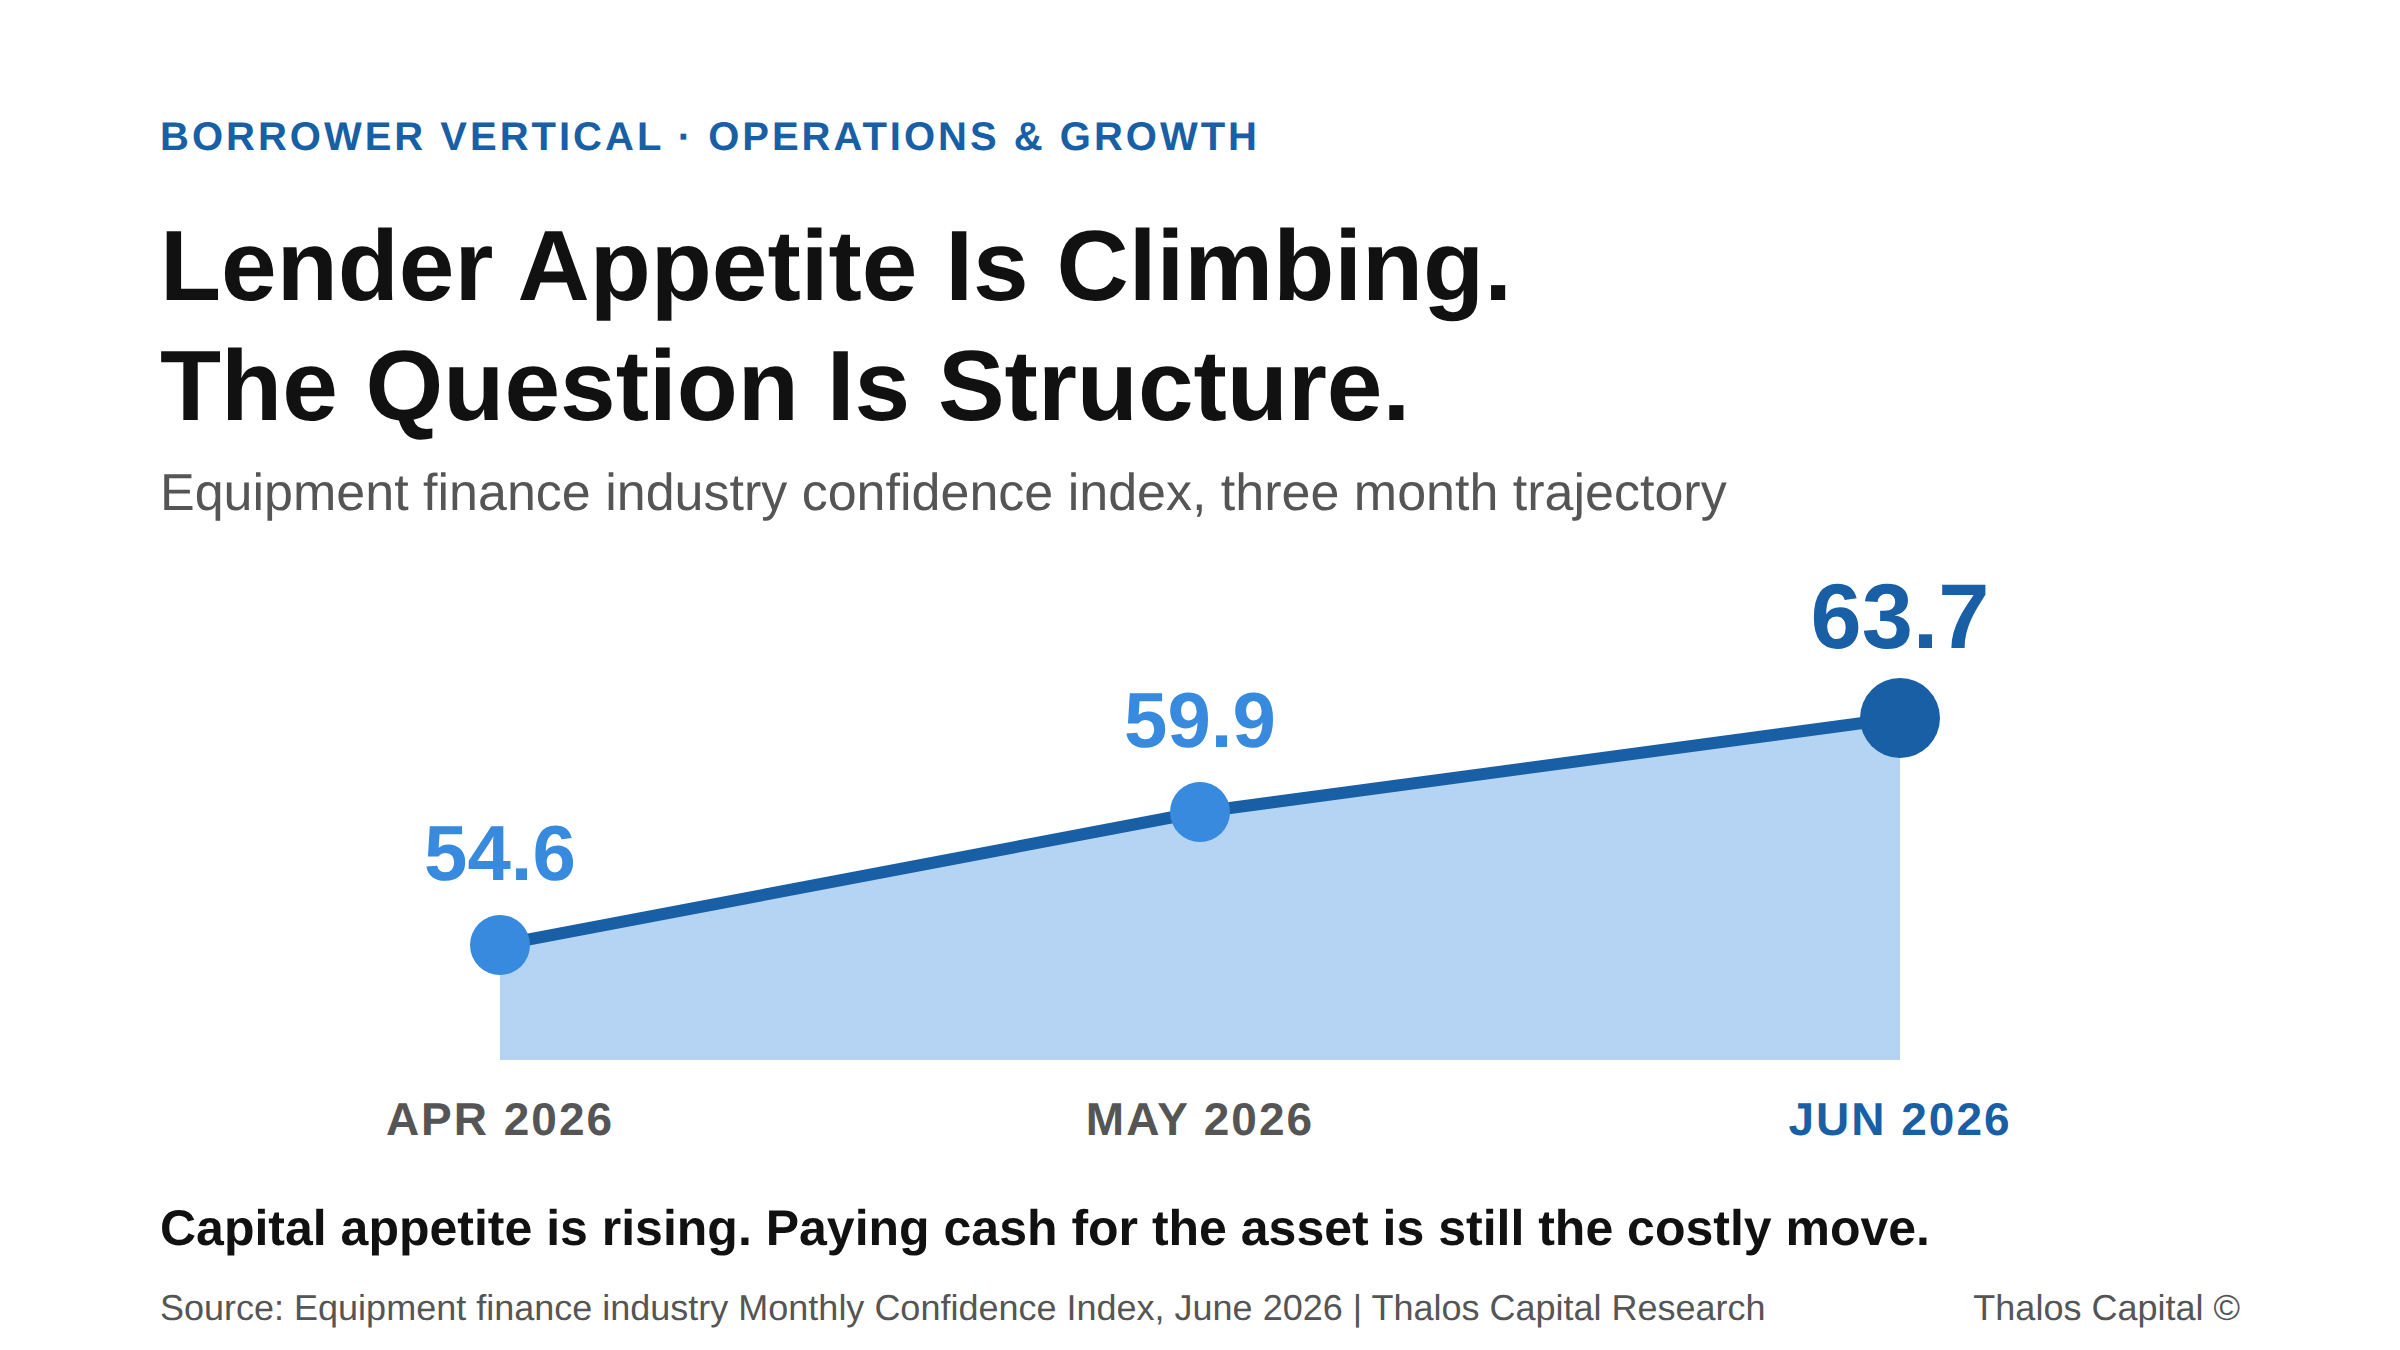
Filled area trend chart showing the equipment finance industry monthly confidence index climbing from 54.6 in April 2026 to 59.9 in May to 63.7 in June.

Paying Cash for Equipment Is Not the Conservative Move. It Is the Expensive One.

Capex demand is rising into a working capital squeeze. Why paying cash for equipment is the expensive move, and how layering the structure preserves the liquidity growth consumes.
Read More
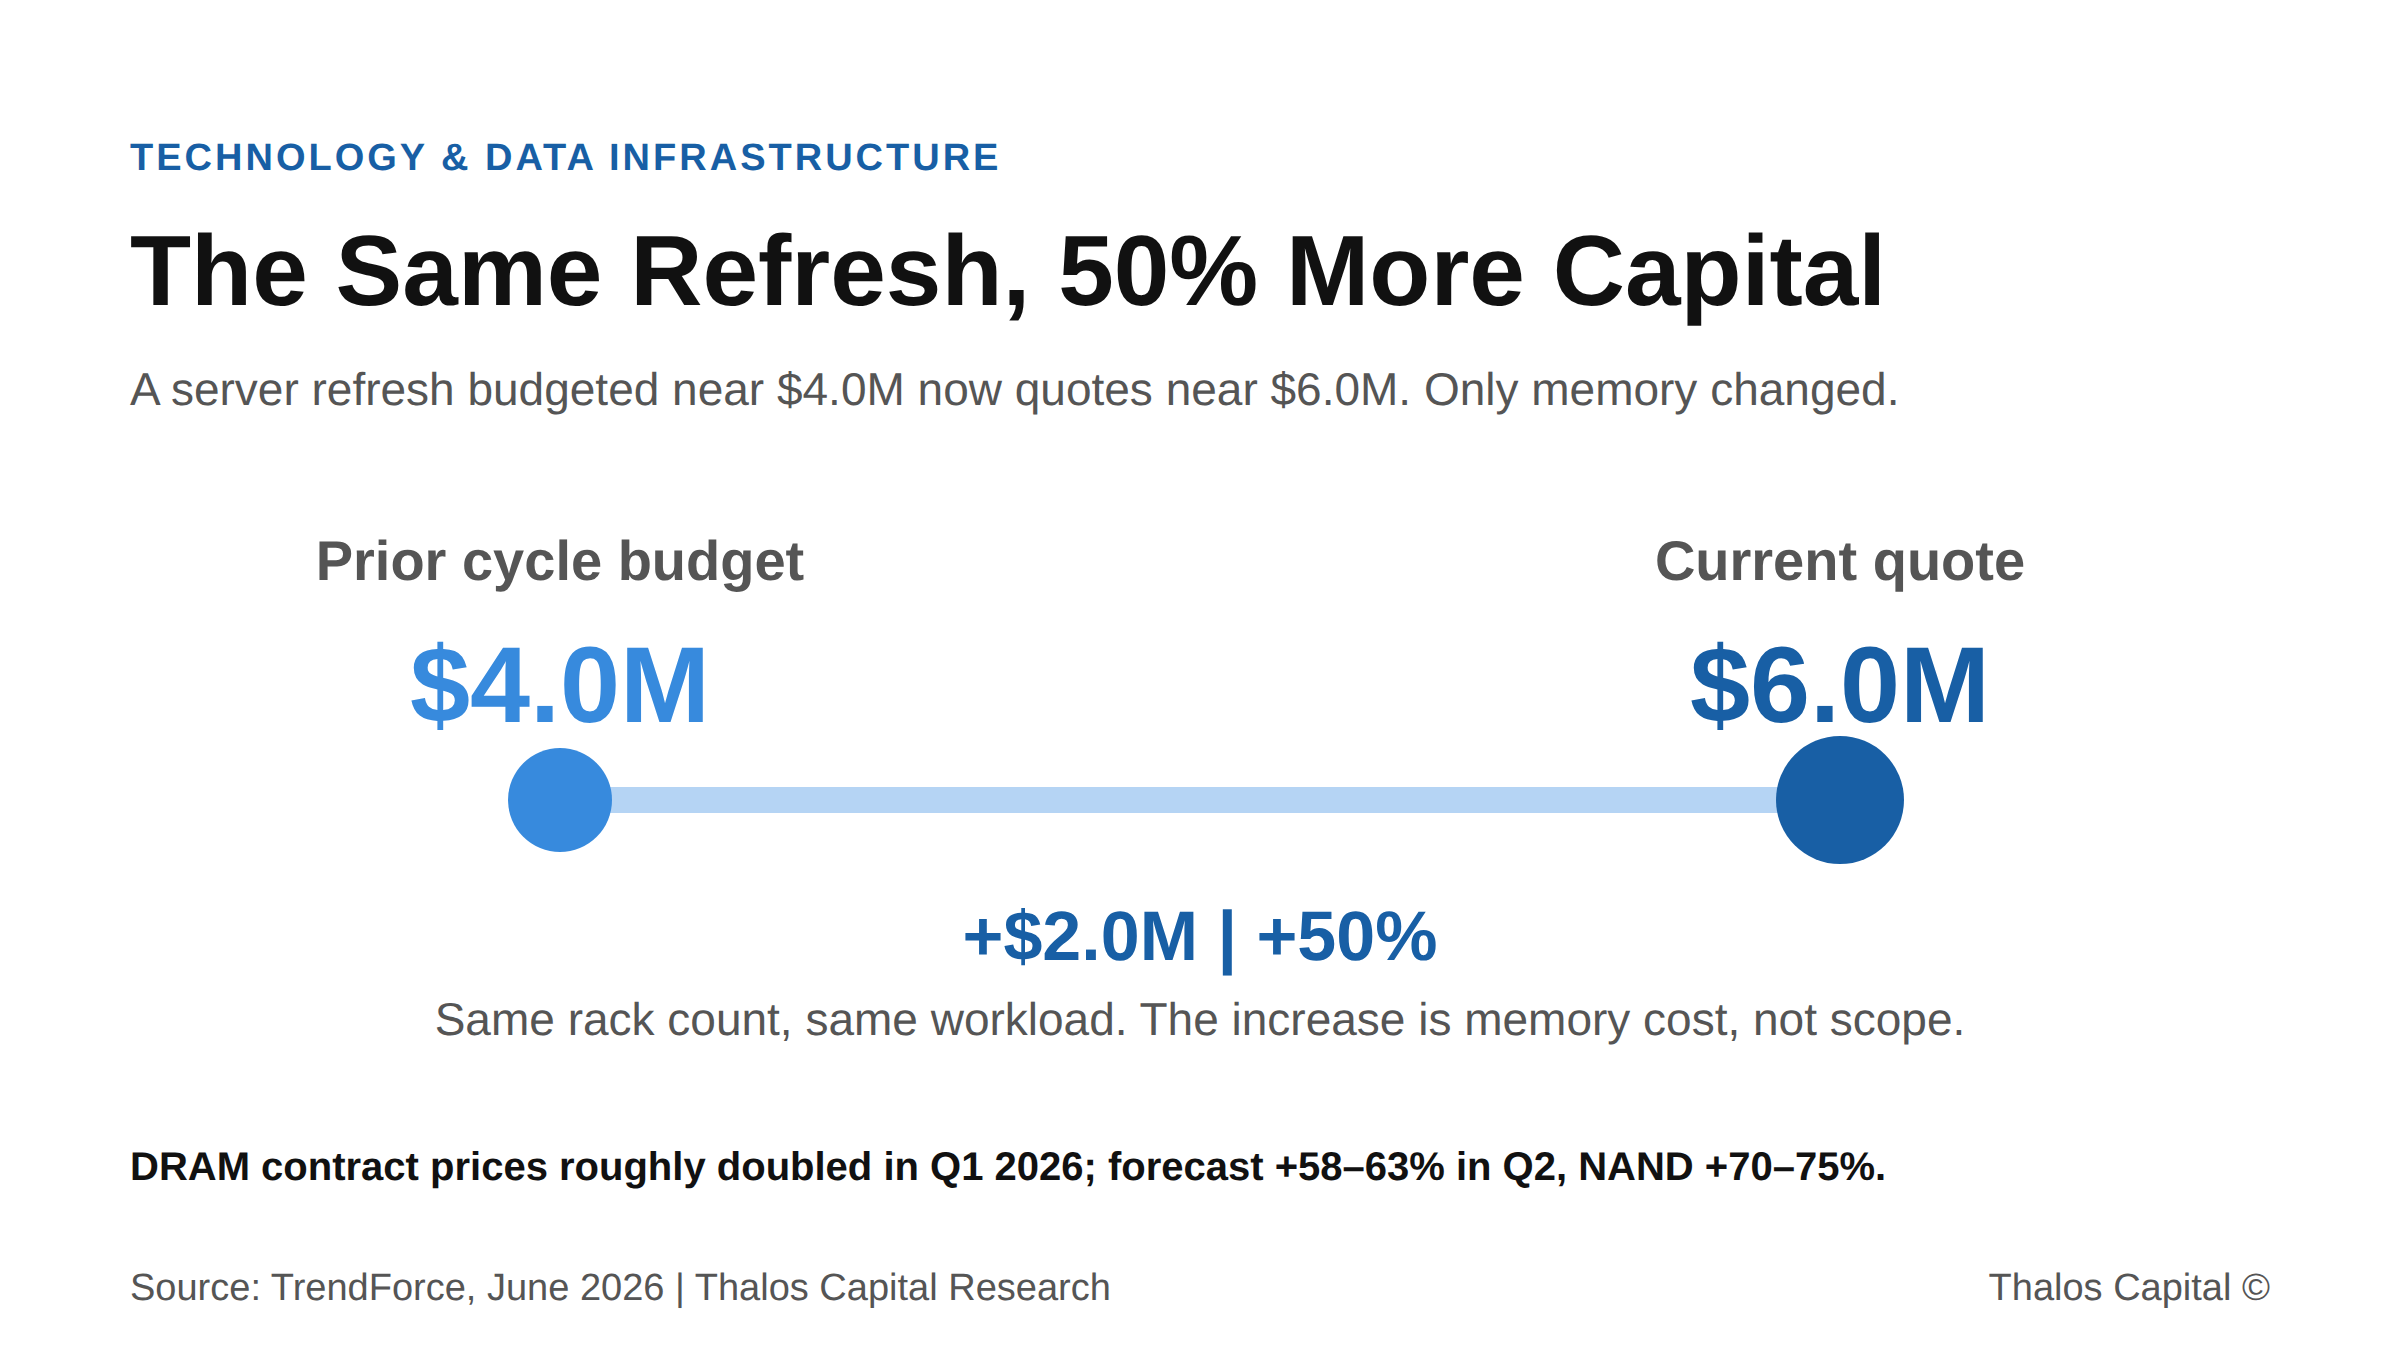
Two-point range chart showing a data-infrastructure refresh rising from a $4.0M prior-cycle budget to a $6.0M current quote, a 50 percent increase driven by 2026 memory price inflation.

The Same Server Refresh Now Costs 50% More: How One Operator Funded It Without Draining the Business

Memory prices doubled in 2026, pushing a $4M server refresh to $6M. How structuring the financing, not paying cash, preserves the liquidity that runs the business.
Read More
Working through a financing decision?
Insights are a starting point. A conversation maps your actual options.
Tell us what you are financing and we will map the structures and sources that fit.
Submit your financing request →
Explore our financing solutions
Equipment FinancingWorking CapitalAsset-Based LendingStrategic Debt