Tag

capital structure

9 insights

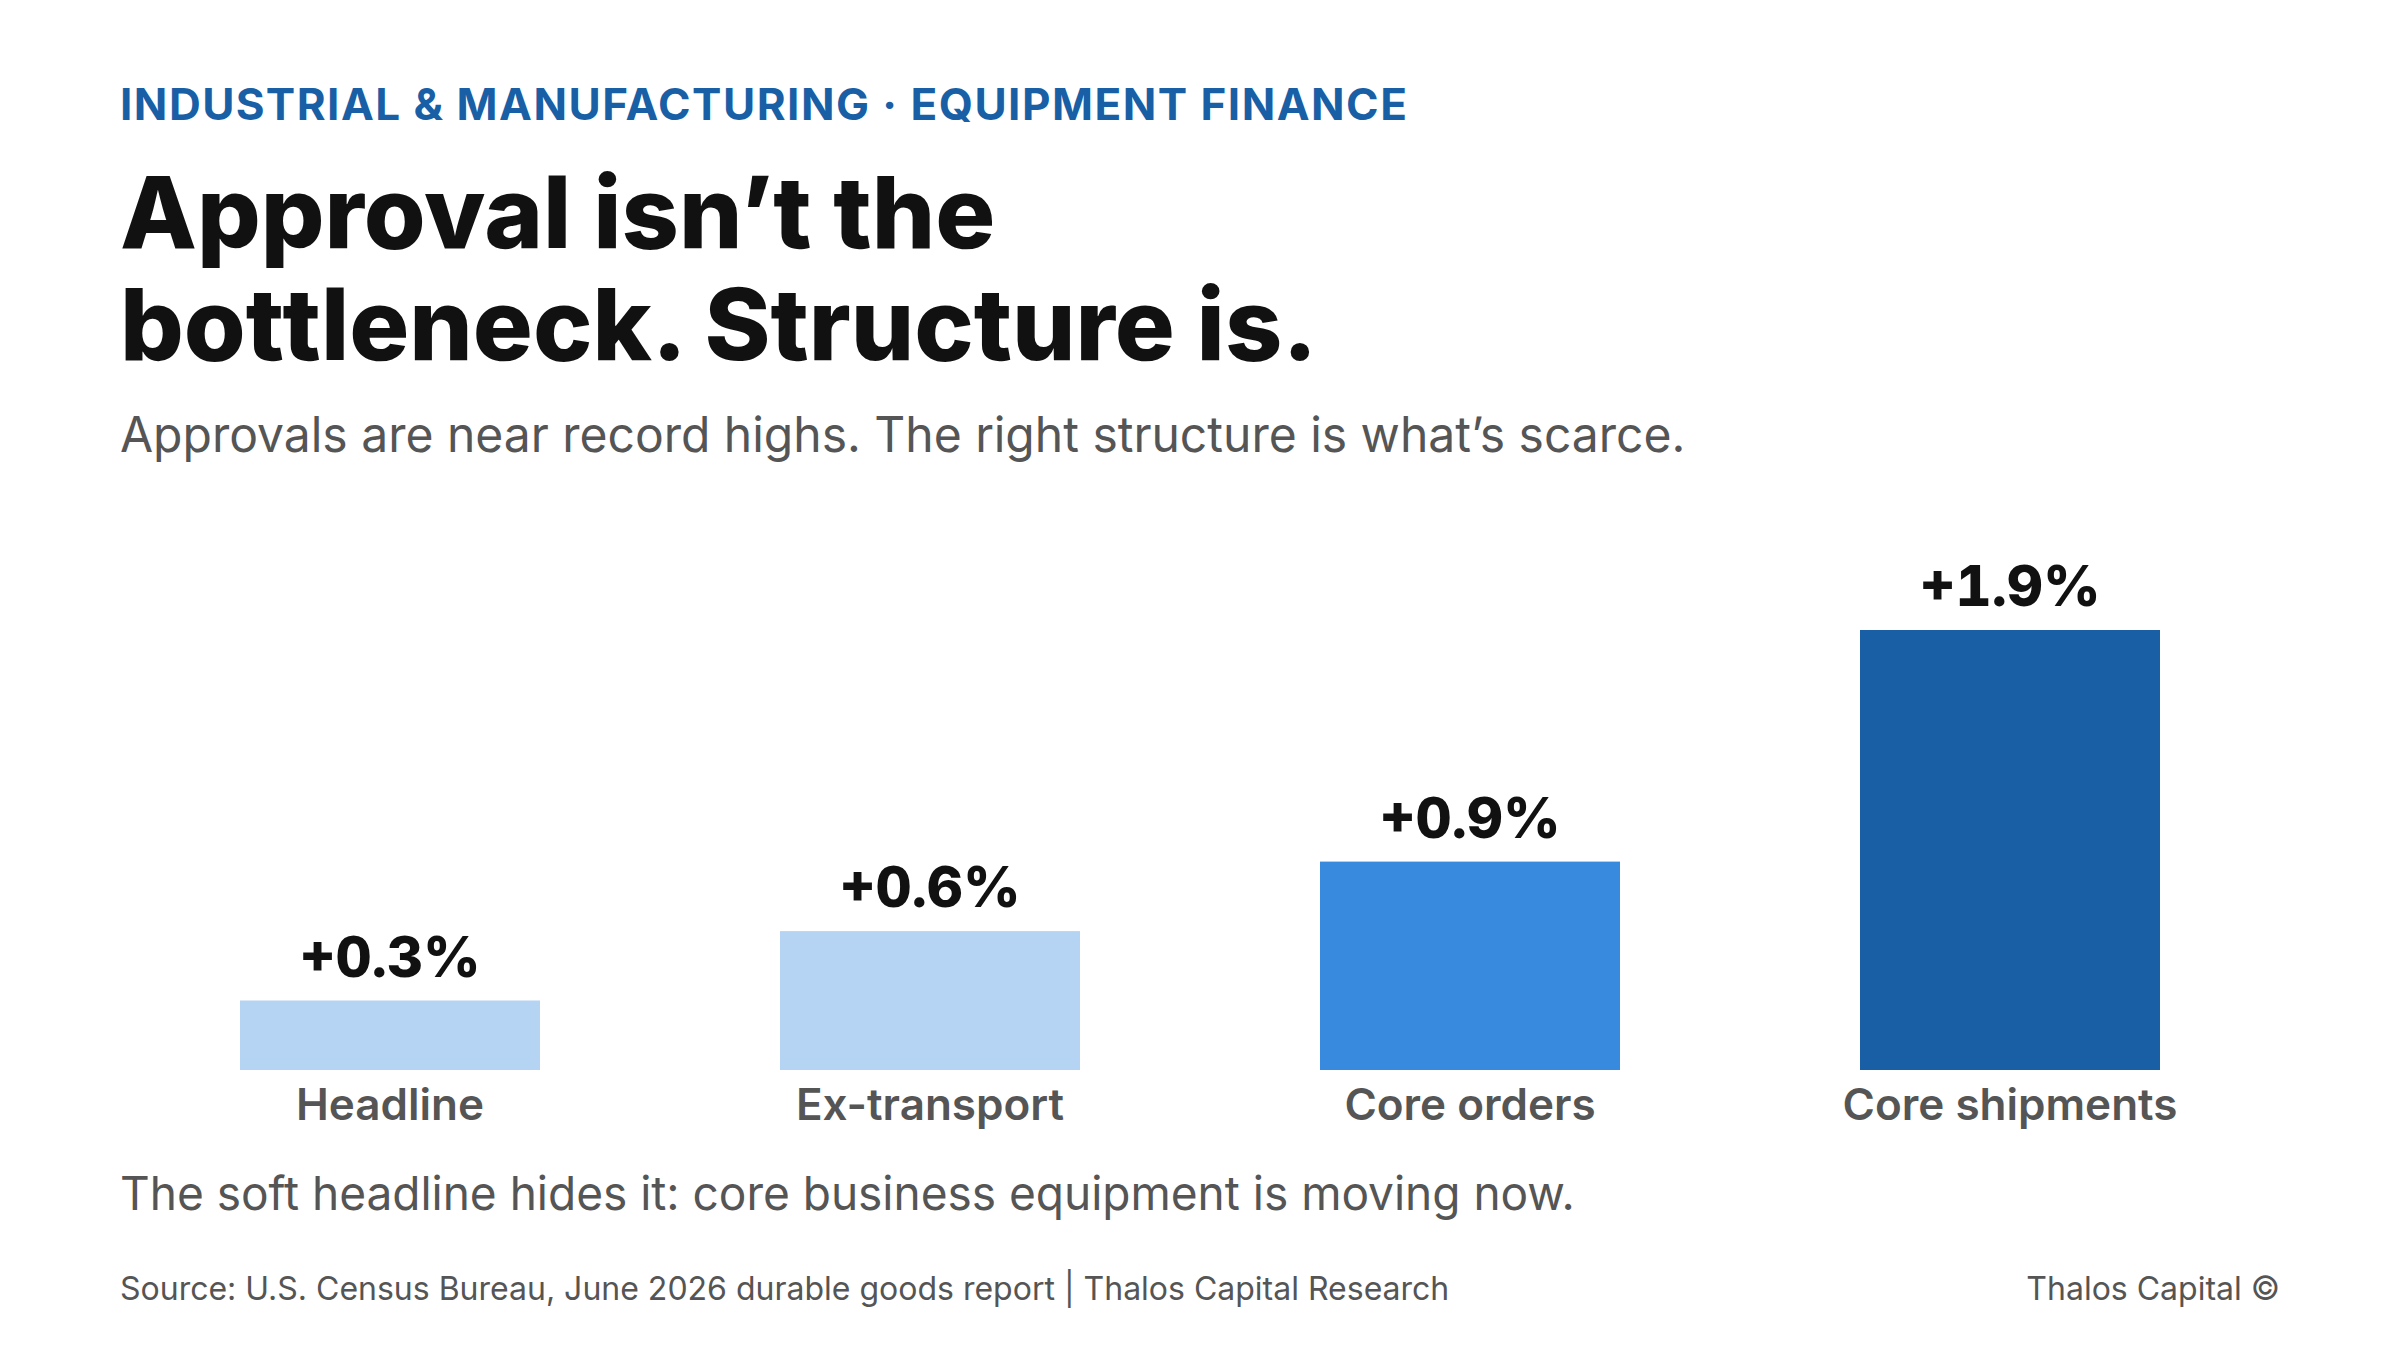
Bar chart of June 2026 durable goods month-over-month change: headline +0.3%, ex-transportation +0.6%, core capital goods orders +0.9%, core capital goods shipments +1.9%, showing strong core business equipment activity.

The Equipment Is Already Shipping. The Financing Decision Should Not Lag It.

Core business-equipment shipments rose 1.9% in June and equipment-finance approvals sit near record highs. For manufacturers, the constraint is no longer approval. It is how the financing is structured against the asset.
Read More
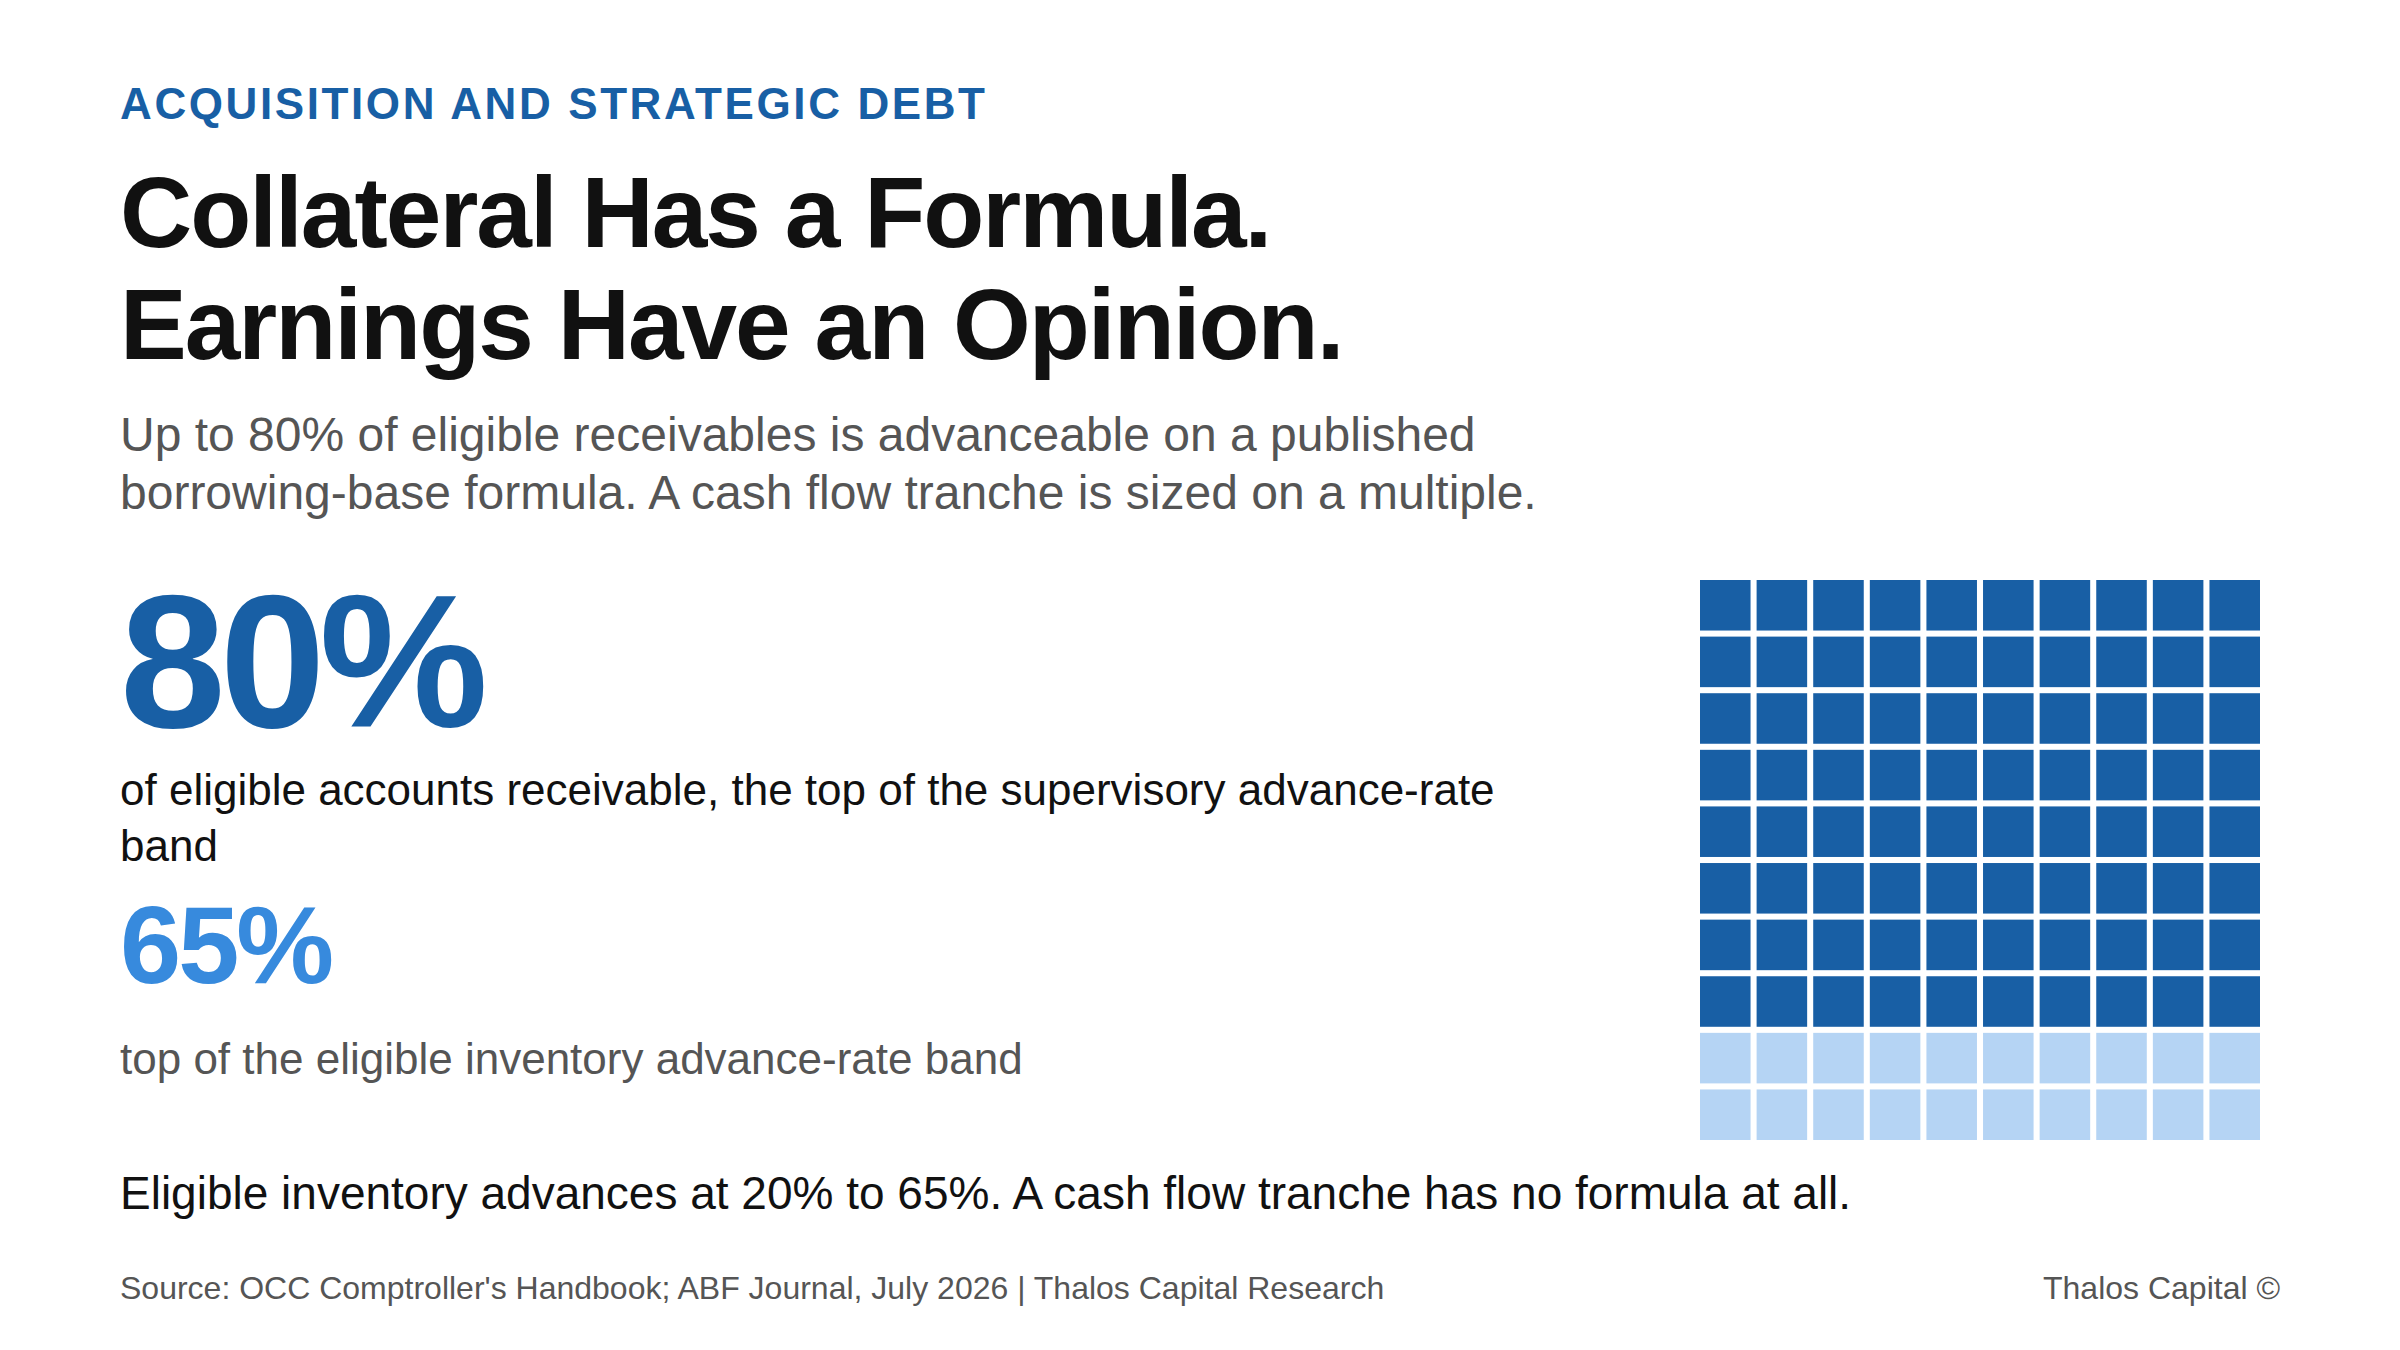
Squares pictogram showing 80 of 100 filled, representing the top of the 70 to 80 percent advance-rate band on eligible accounts receivable under a borrowing-base formula, with the 65 percent eligible inventory ceiling shown alongside.

You Are Buying a Balance Sheet and Financing It Like a Cash Flow Statement

Two facilities priced 200 to 250 basis points apart in the same week. The difference was collateral, not credit. Why acquisition debt sized only on EBITDA leaves both pricing and capacity on the table.
Read More
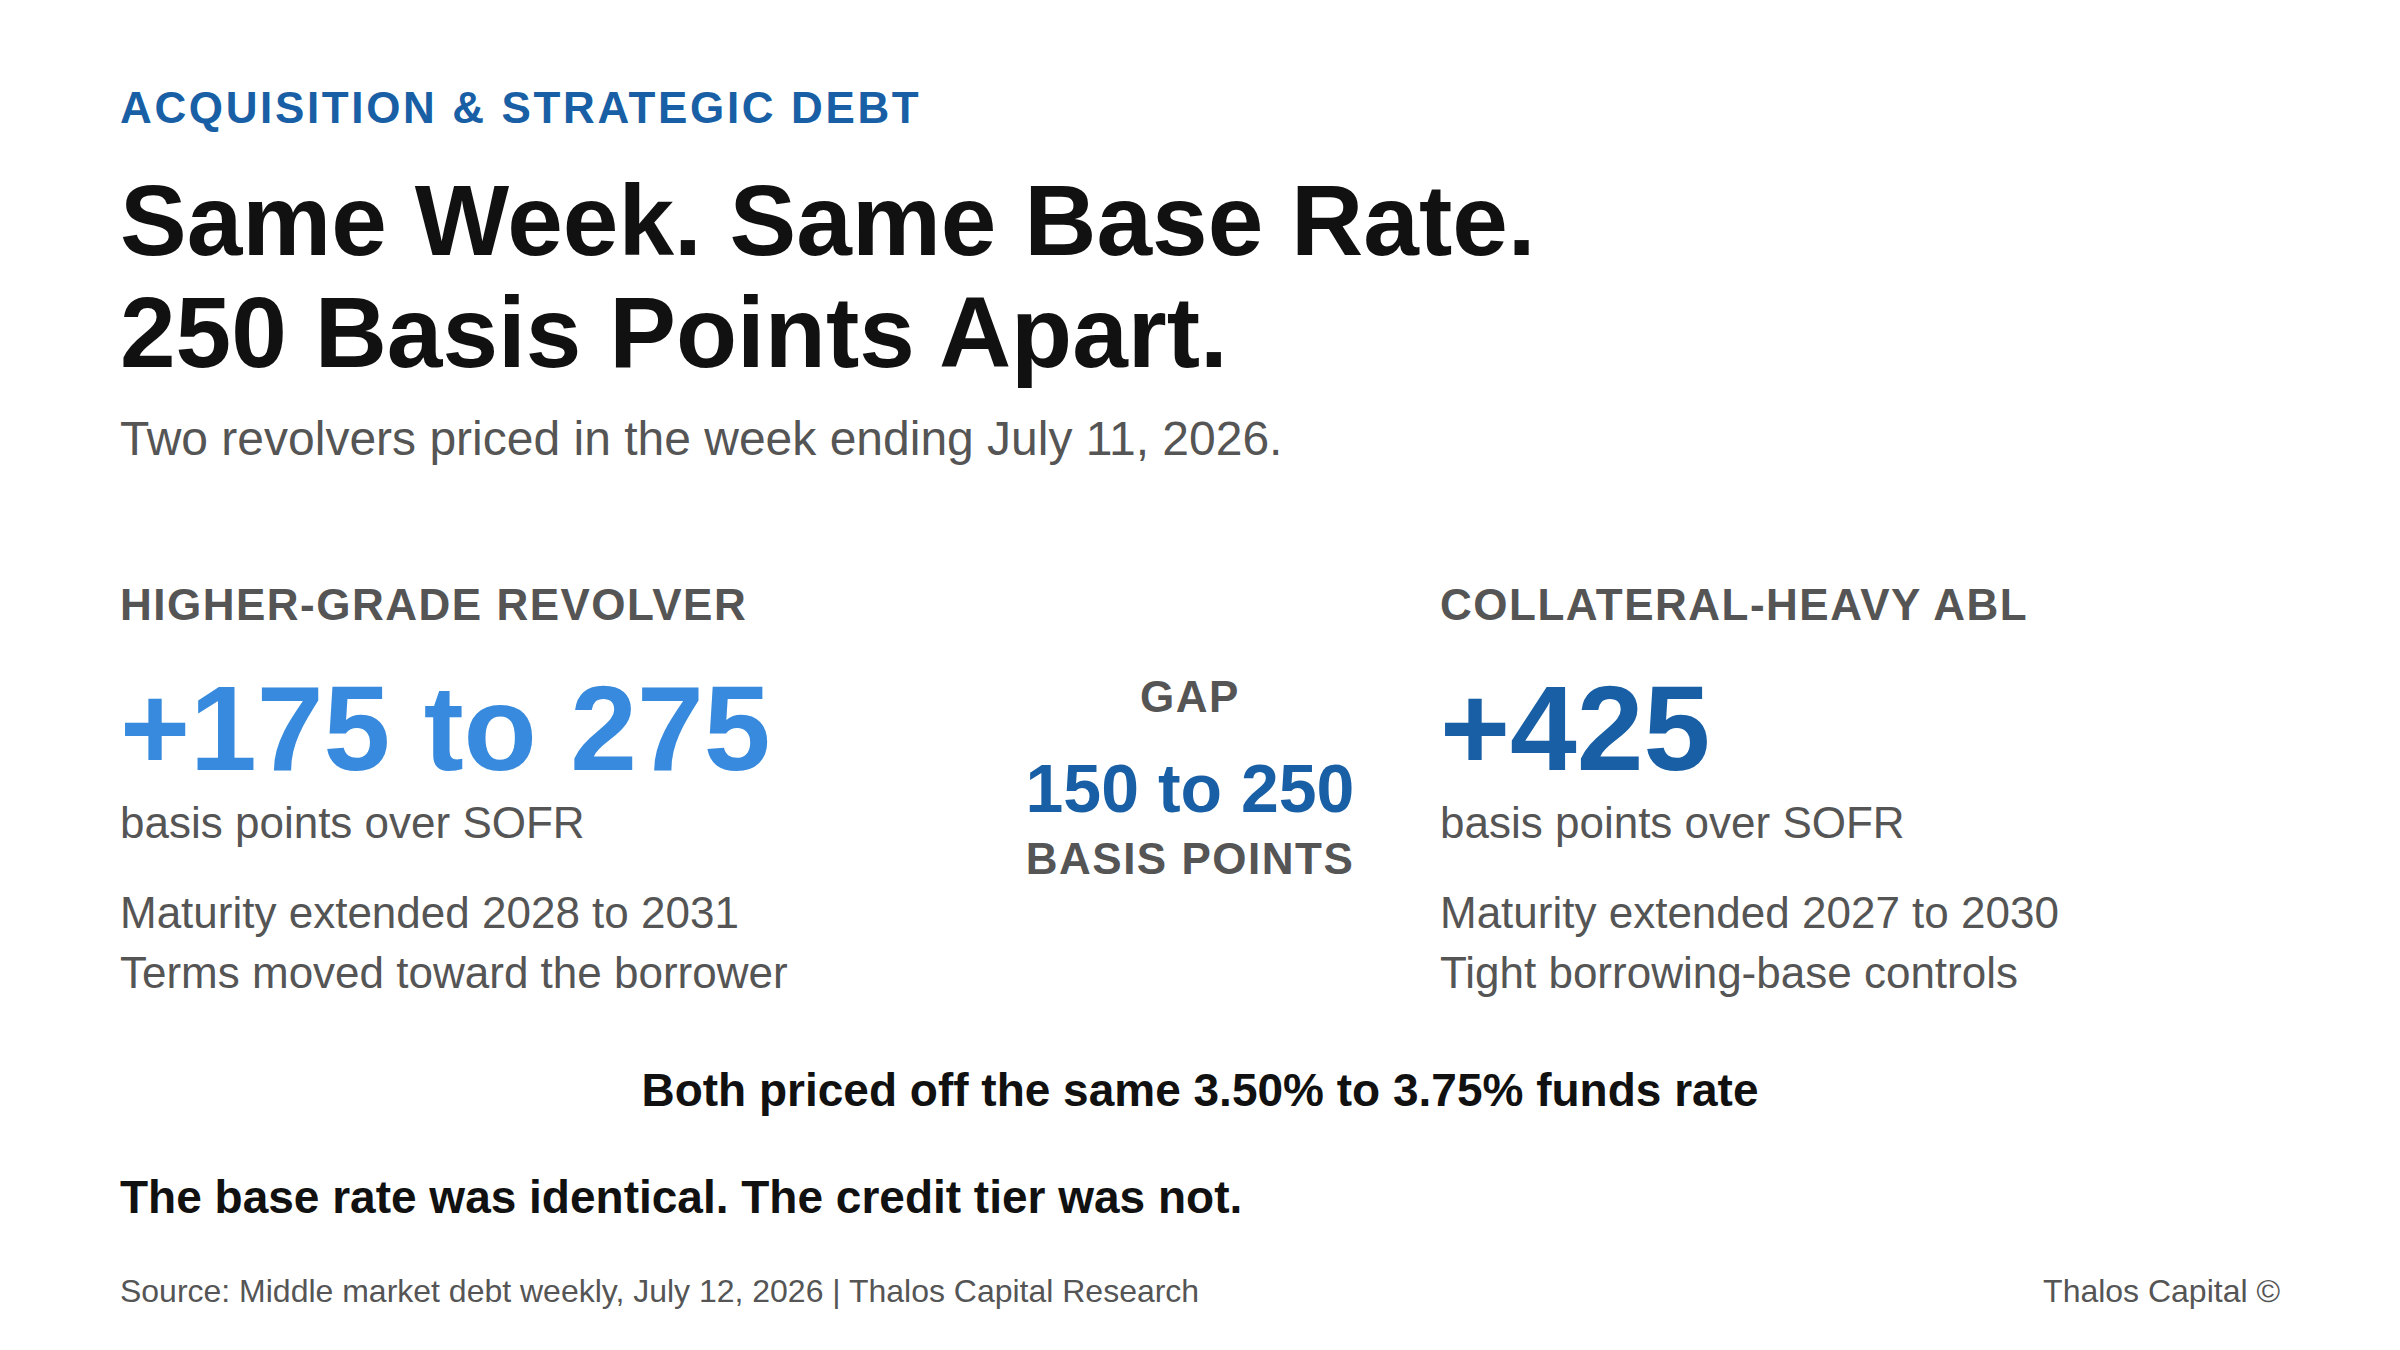
Contrast chart showing a higher-grade revolver priced at 175 to 275 basis points over SOFR against a collateral-heavy asset-based revolver at 425 basis points, both priced off the same 3.50% to 3.75% funds rate.

Same Week, Same Base Rate, 250 Basis Points Apart

Two revolvers priced in the same week of July 2026 carried spreads 150 to 250 basis points apart on an identical base rate. The difference was credit tier, and tier is something a borrower can change.
Read More
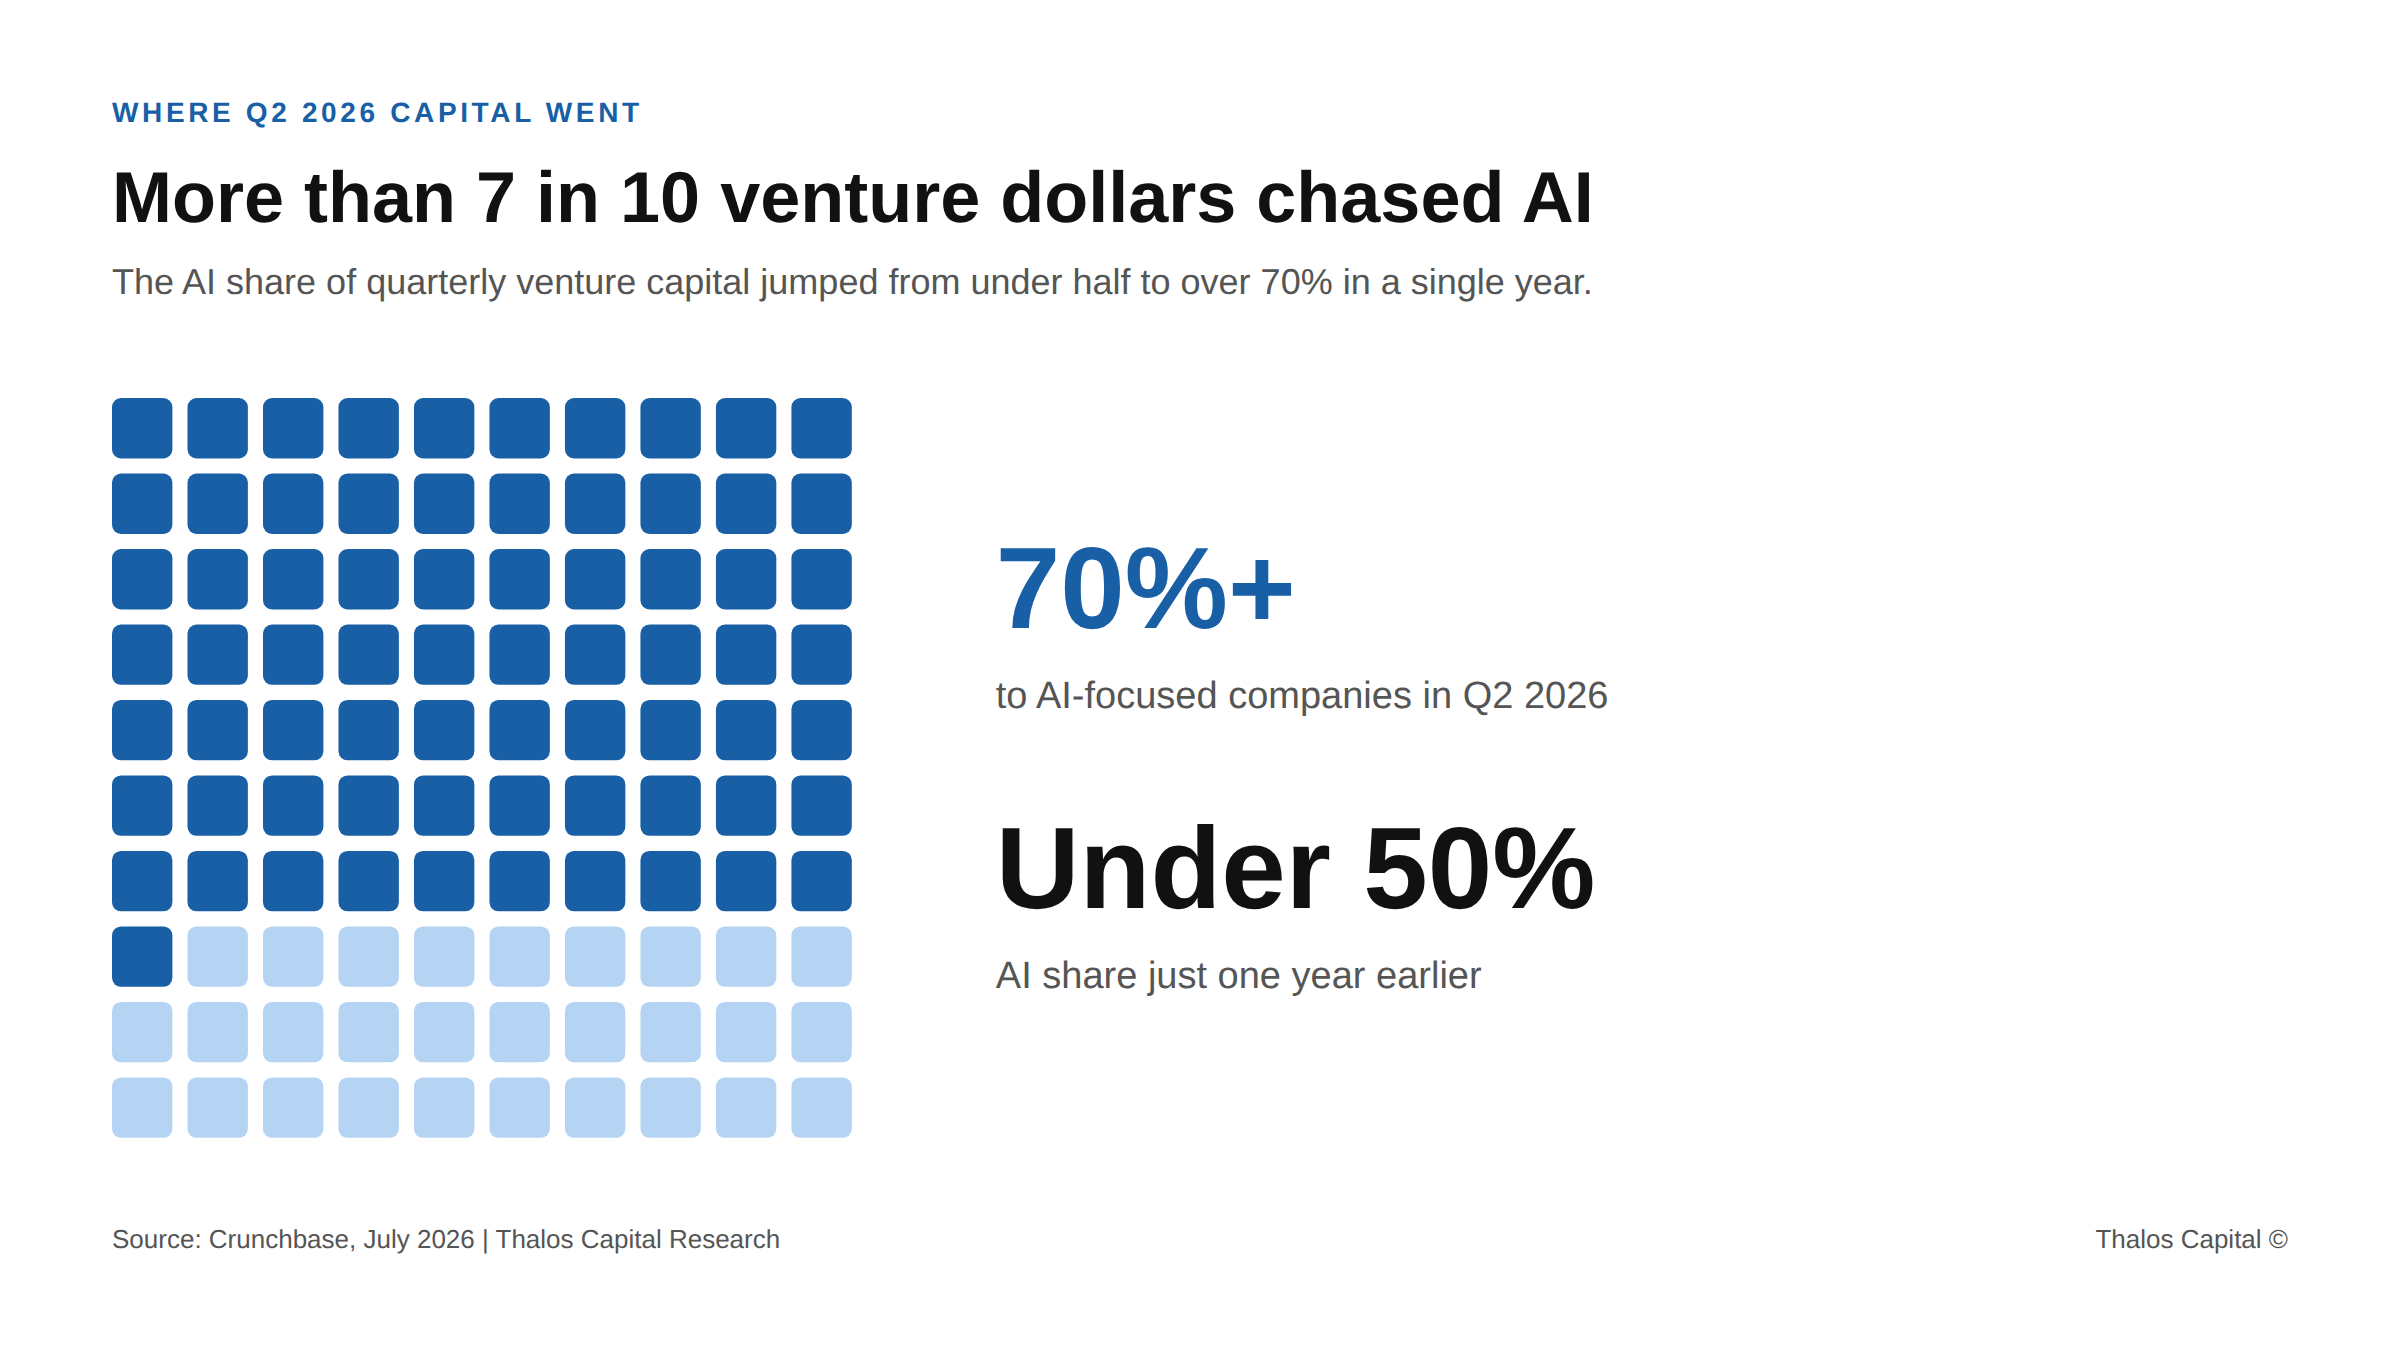
Waffle chart of 100 squares showing more than 70% of Q2 2026 venture capital going to AI-focused companies, up from under 50% a year earlier, with 43% of all H1 2026 funding taken by two AI companies and $293B left for every other company.

The Record Funding Year Is Not Funding You

Venture funding hit a record $510B in H1 2026, but 43% went to two AI companies. Why recurring-revenue tech founders are misreading the headline, and the non-dilutive alternative.
Read More
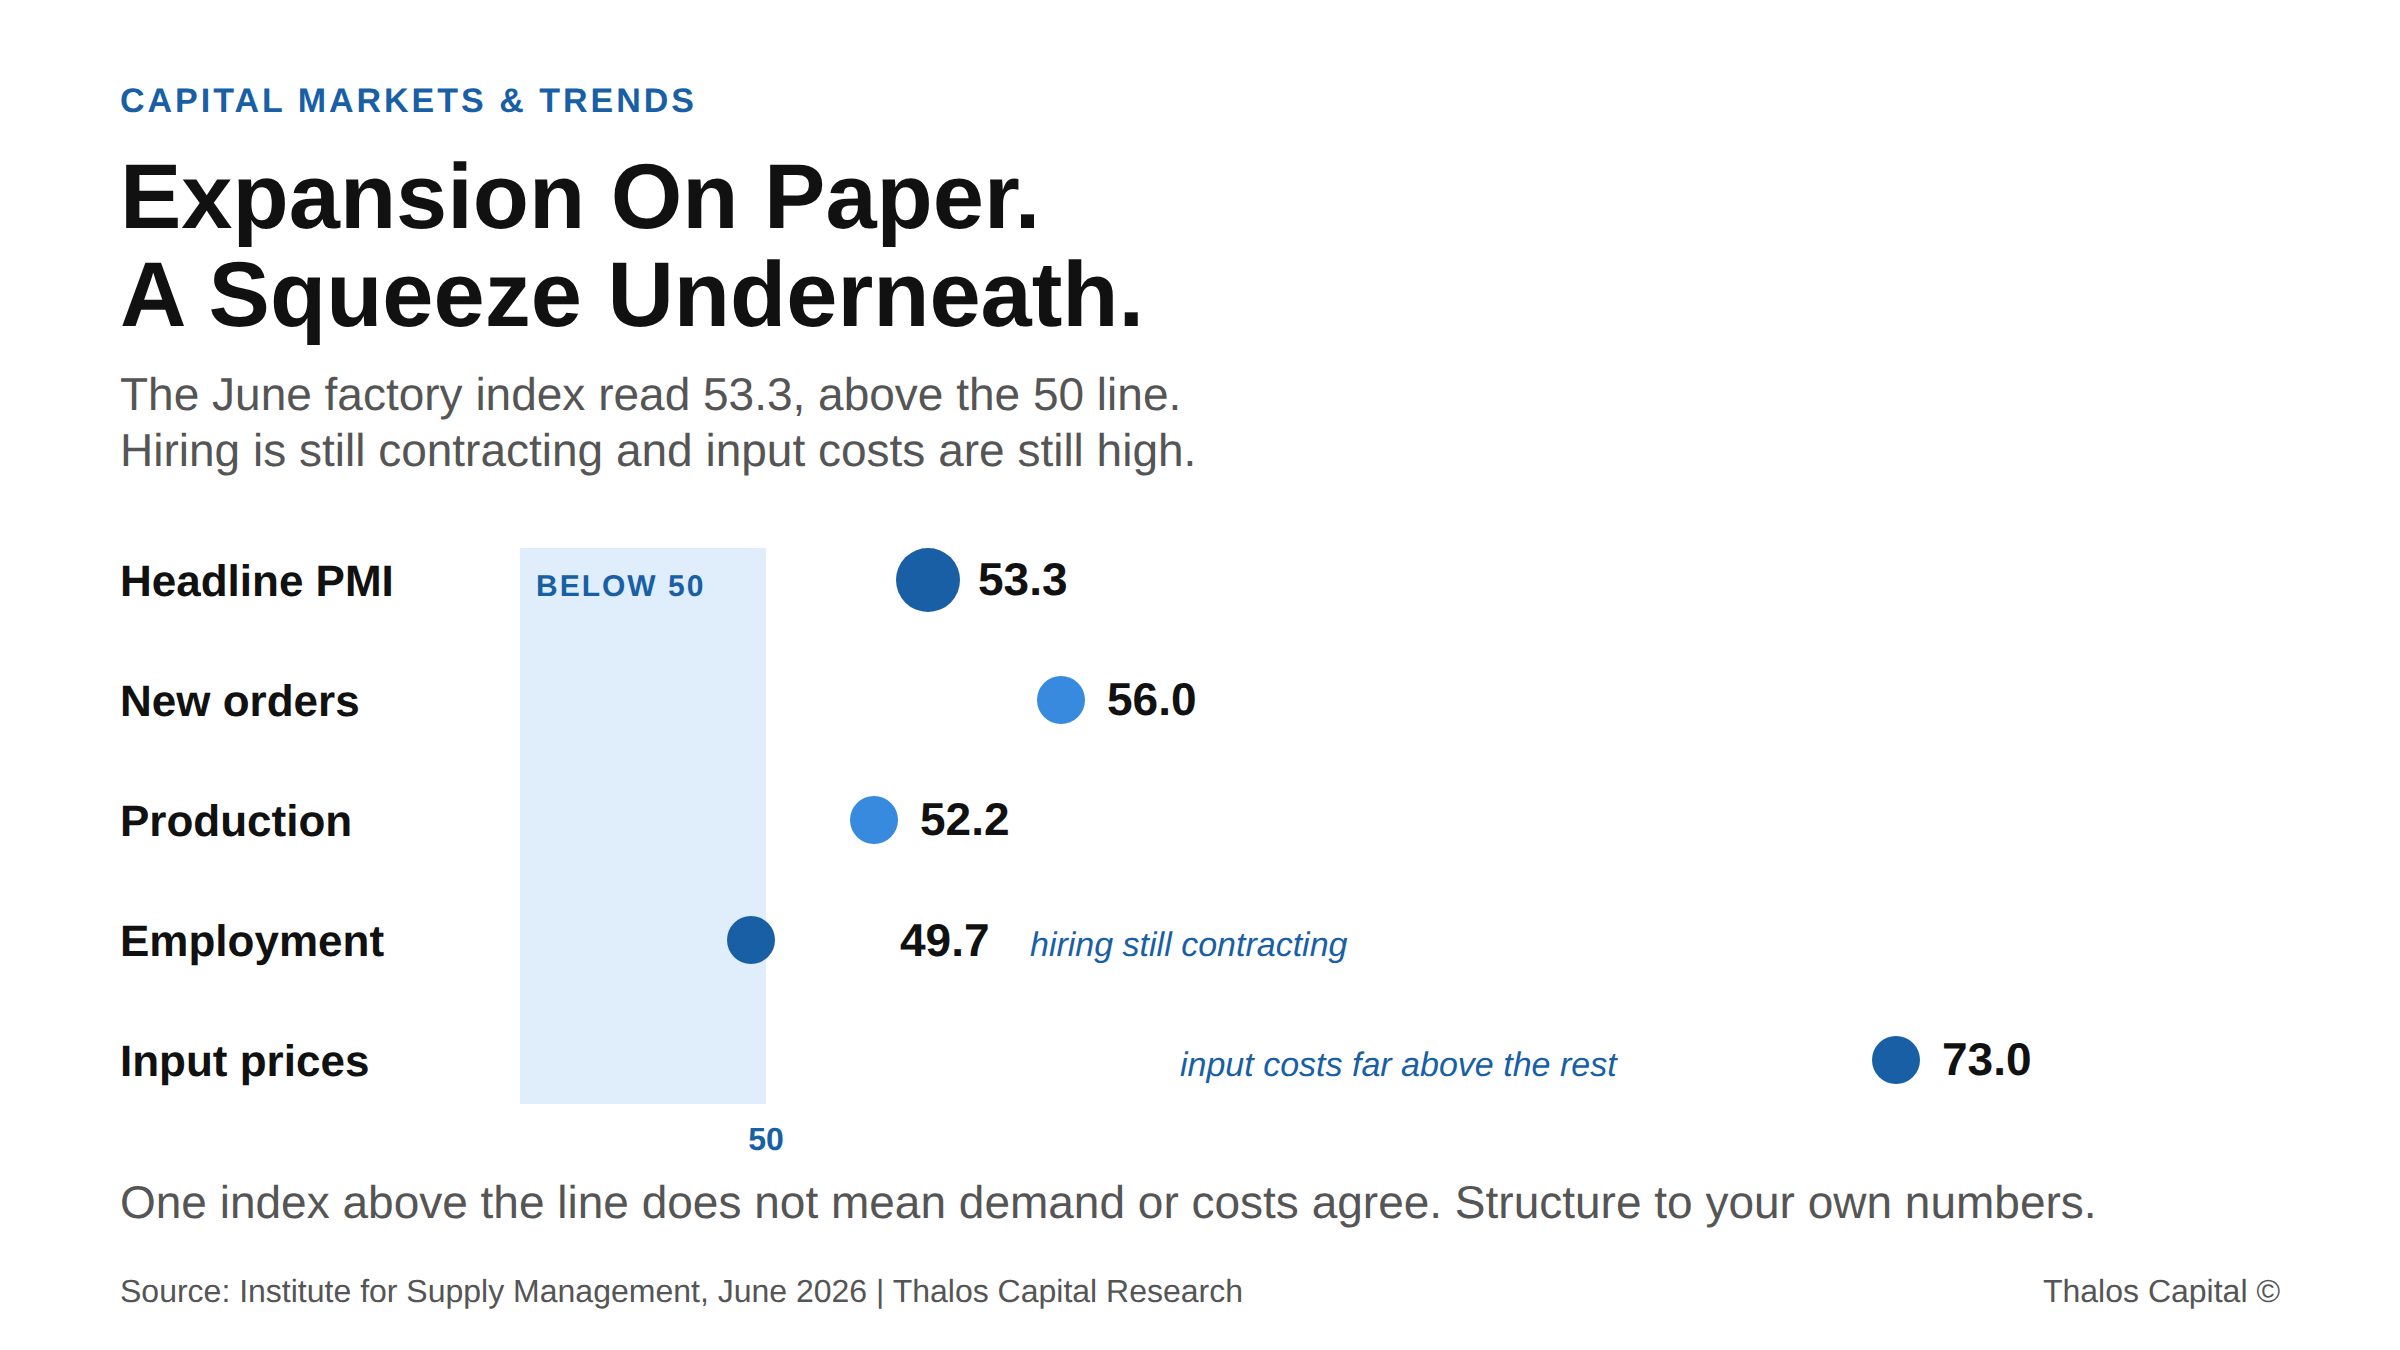
Dot plot of June 2026 factory index components showing headline PMI at 53.3 above the 50 line while employment sits at 49.7 in contraction and input prices at 73.0 remain elevated.

Expansion On Paper. A Squeeze Underneath.

A factory index above 50 reads as a growth signal, but hiring is still contracting and input costs are still high. Why financing sized to the headline misreads a margin story as a volume story.
Read More
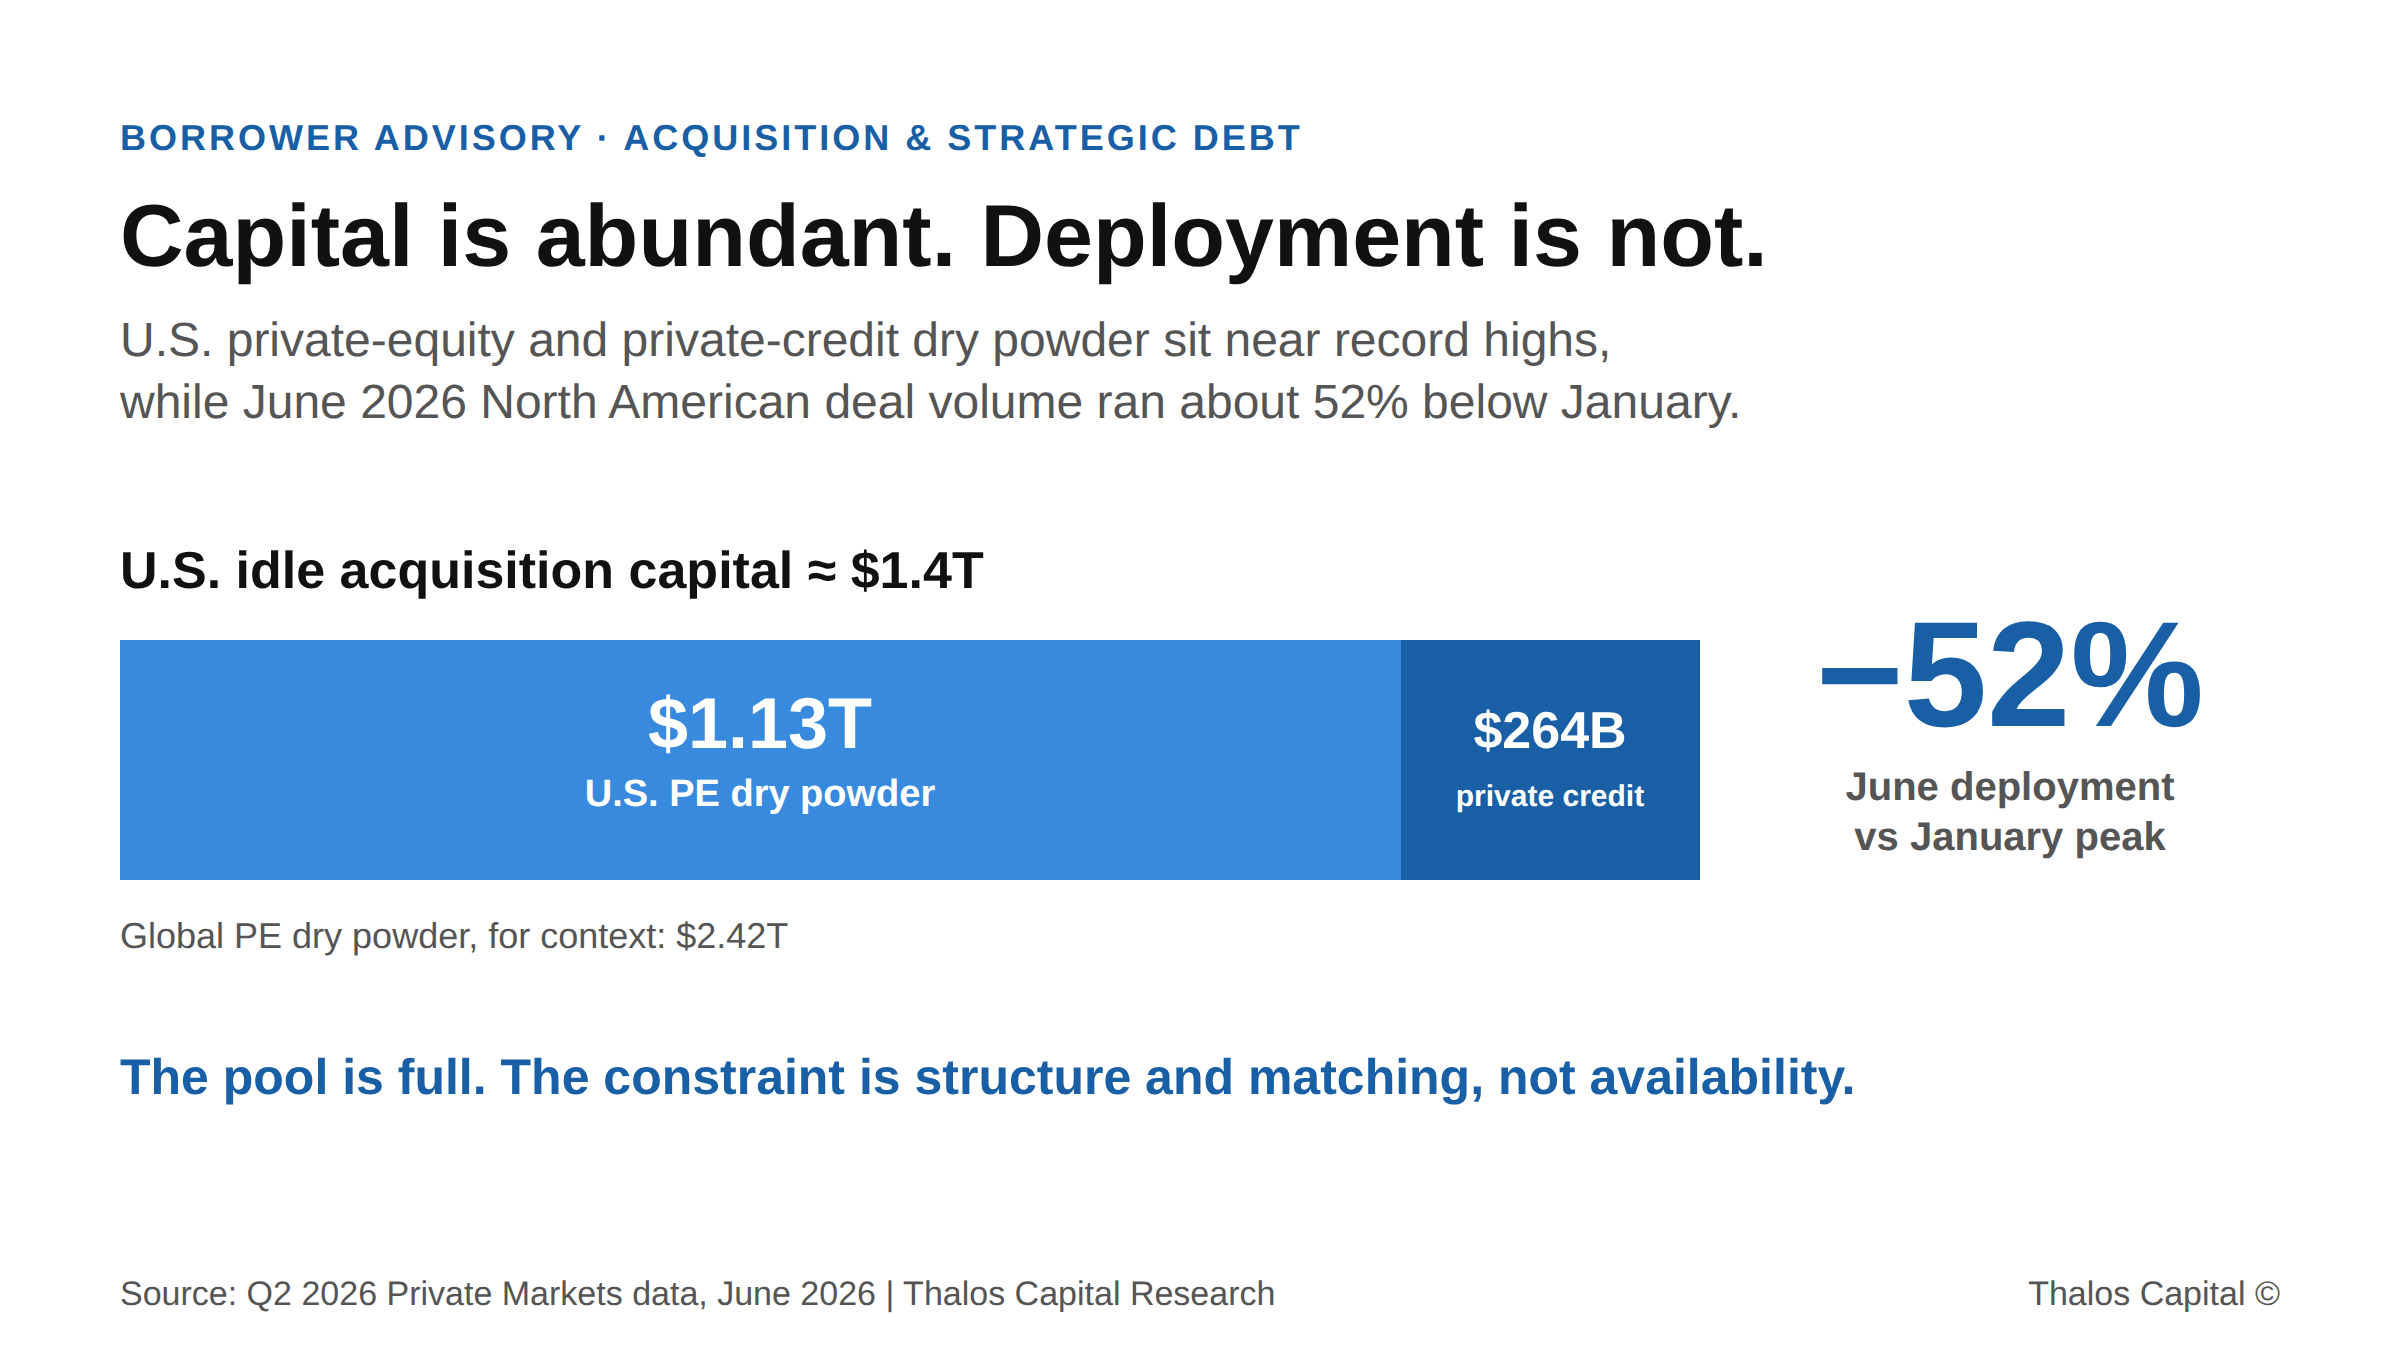
Horizontal stacked bar showing about $1.4T of idle U.S. acquisition capital, split into $1.13T PE dry powder and $264B private-credit dry powder, against a −52% drop in June 2026 deal deployment versus January.

Capital Is Not Scarce. It Is Just Not Moving.

U.S. acquisition capital sits near record levels while deal volume has fallen by half. The binding constraint for buyers now is structure and matching, not availability.
Read More
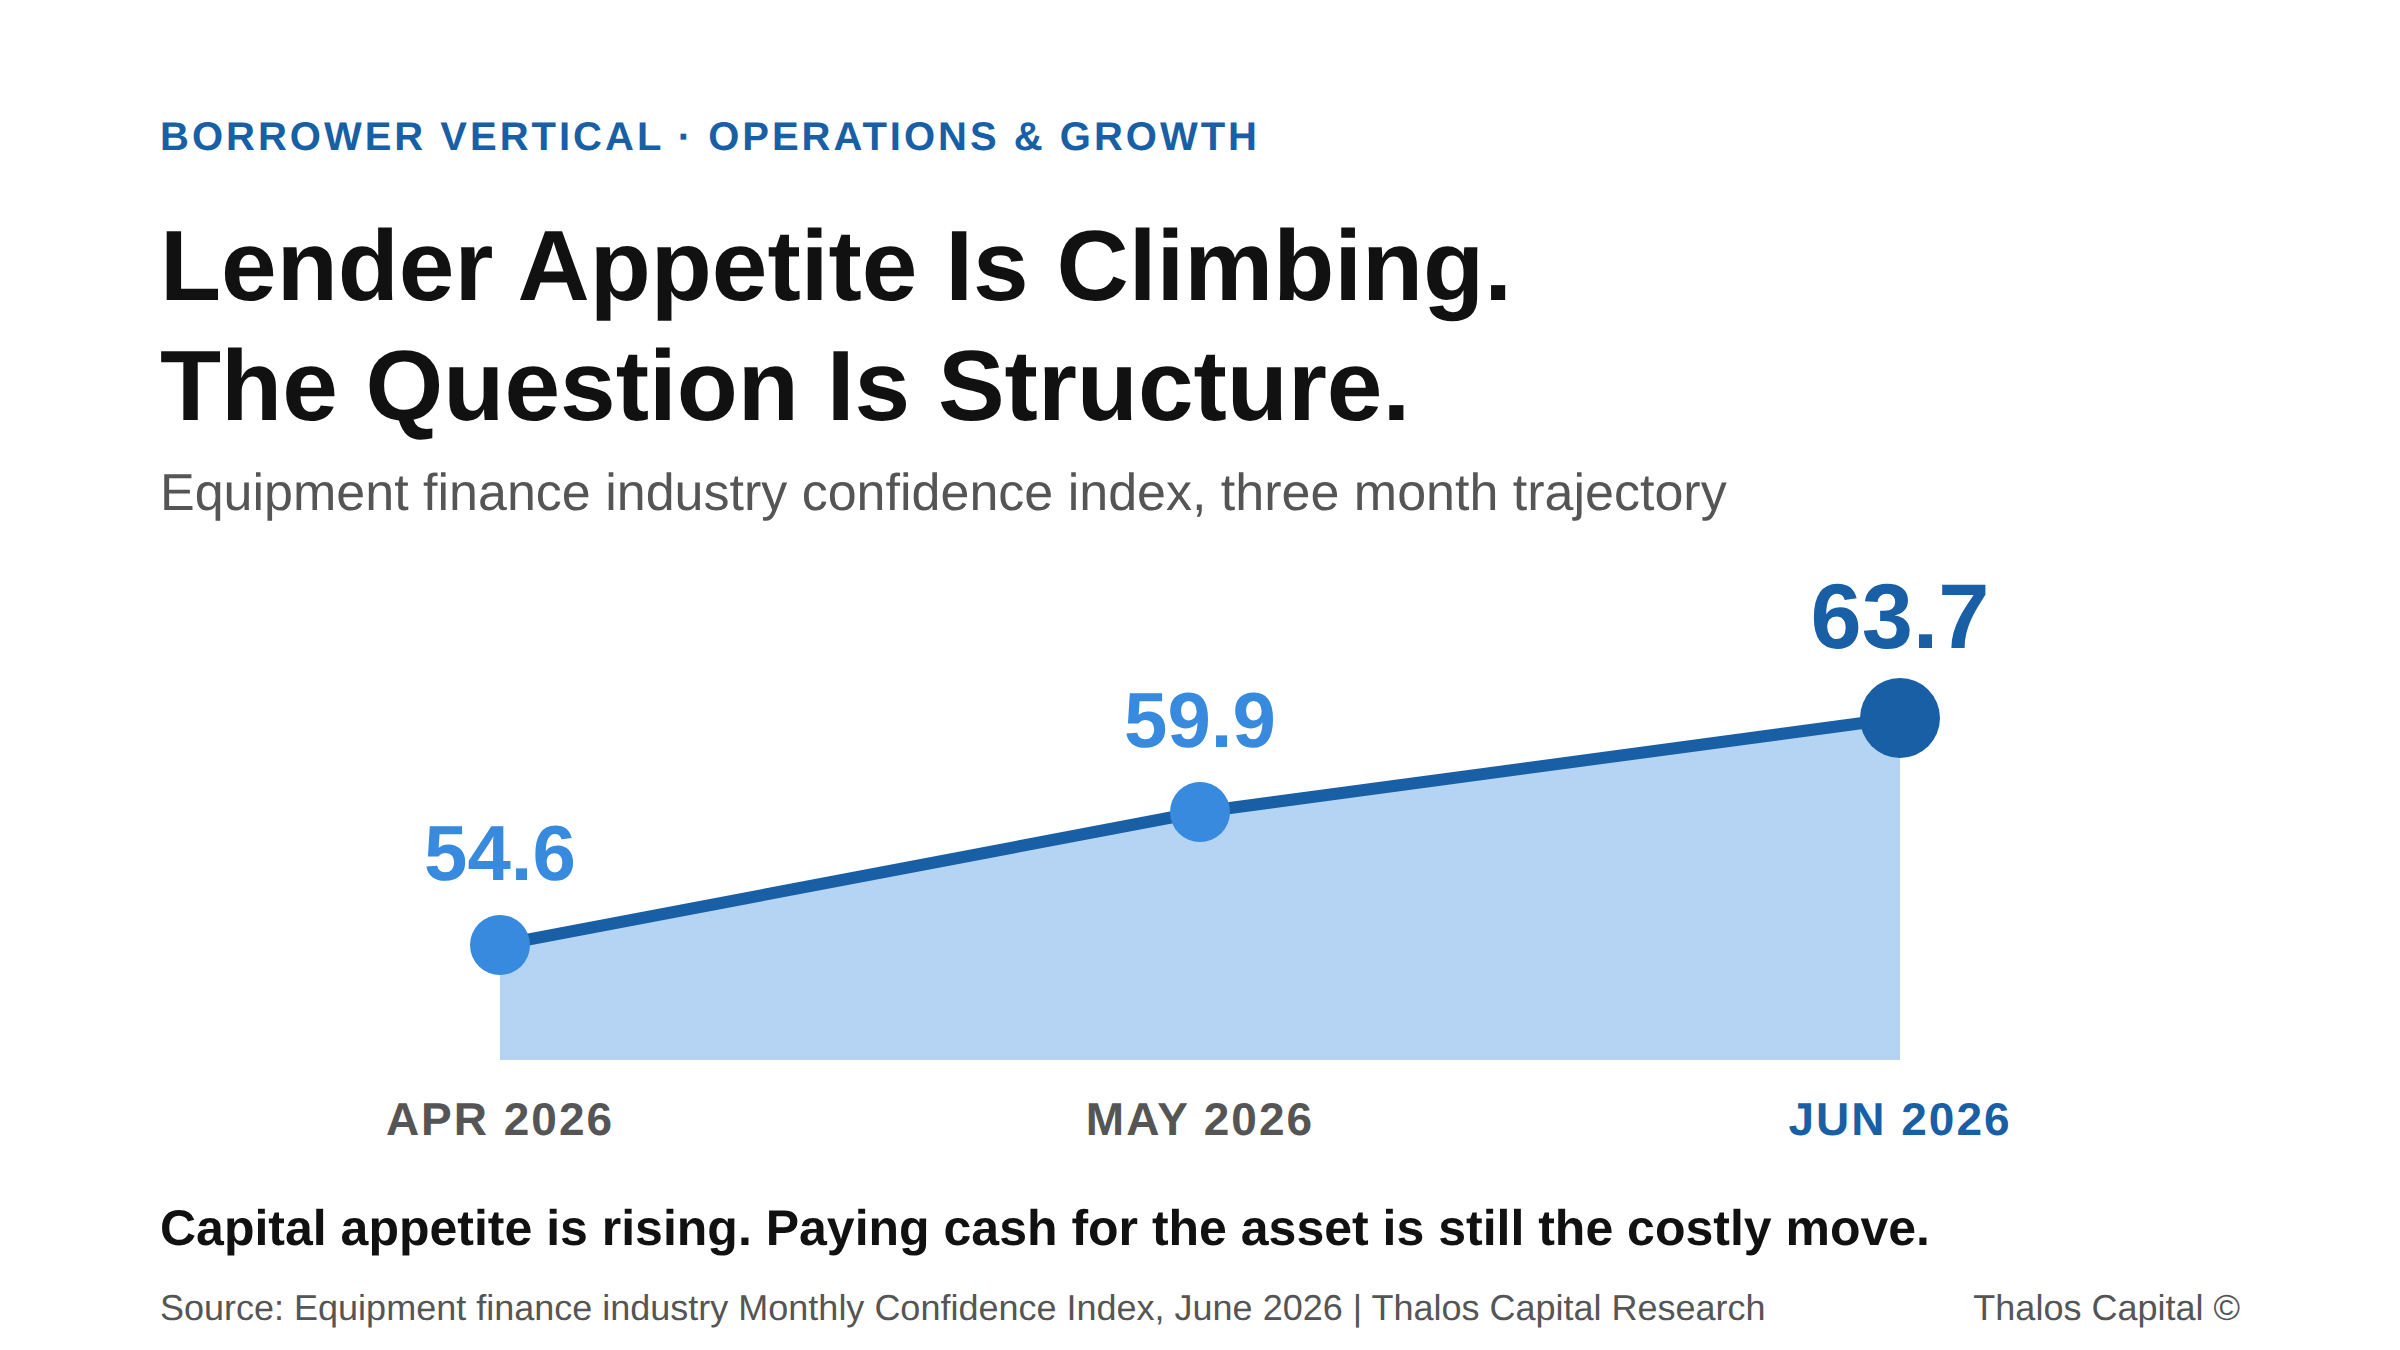
Filled area trend chart showing the equipment finance industry monthly confidence index climbing from 54.6 in April 2026 to 59.9 in May to 63.7 in June.

Paying Cash for Equipment Is Not the Conservative Move. It Is the Expensive One.

Capex demand is rising into a working capital squeeze. Why paying cash for equipment is the expensive move, and how layering the structure preserves the liquidity growth consumes.
Read More
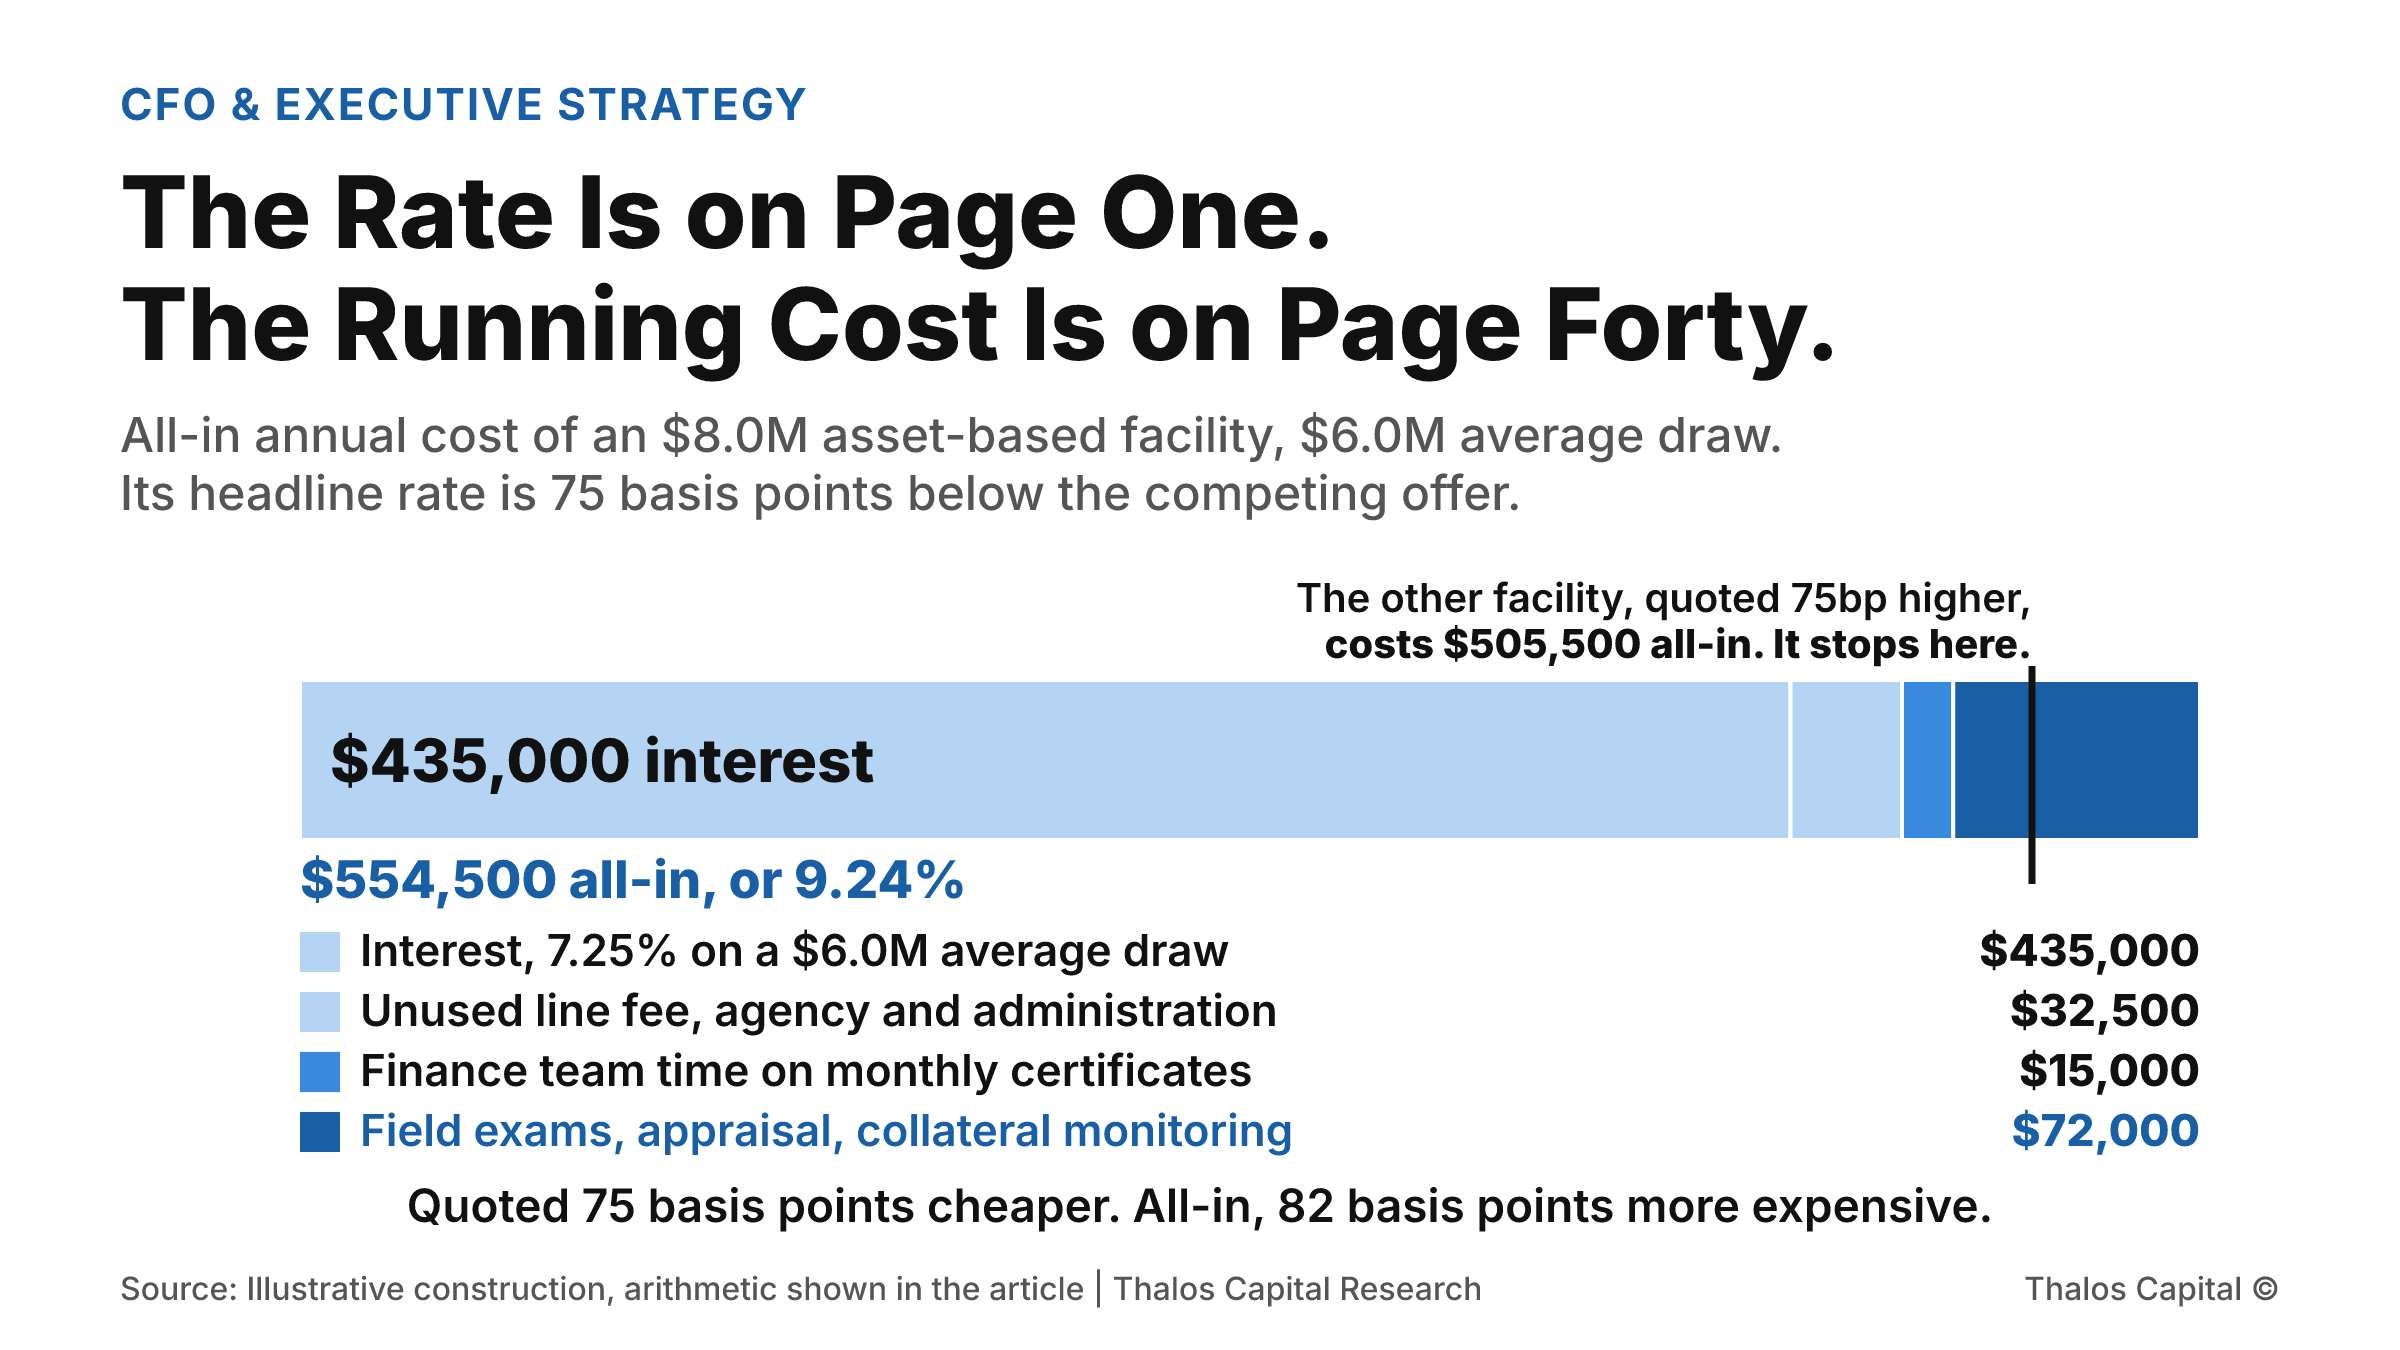
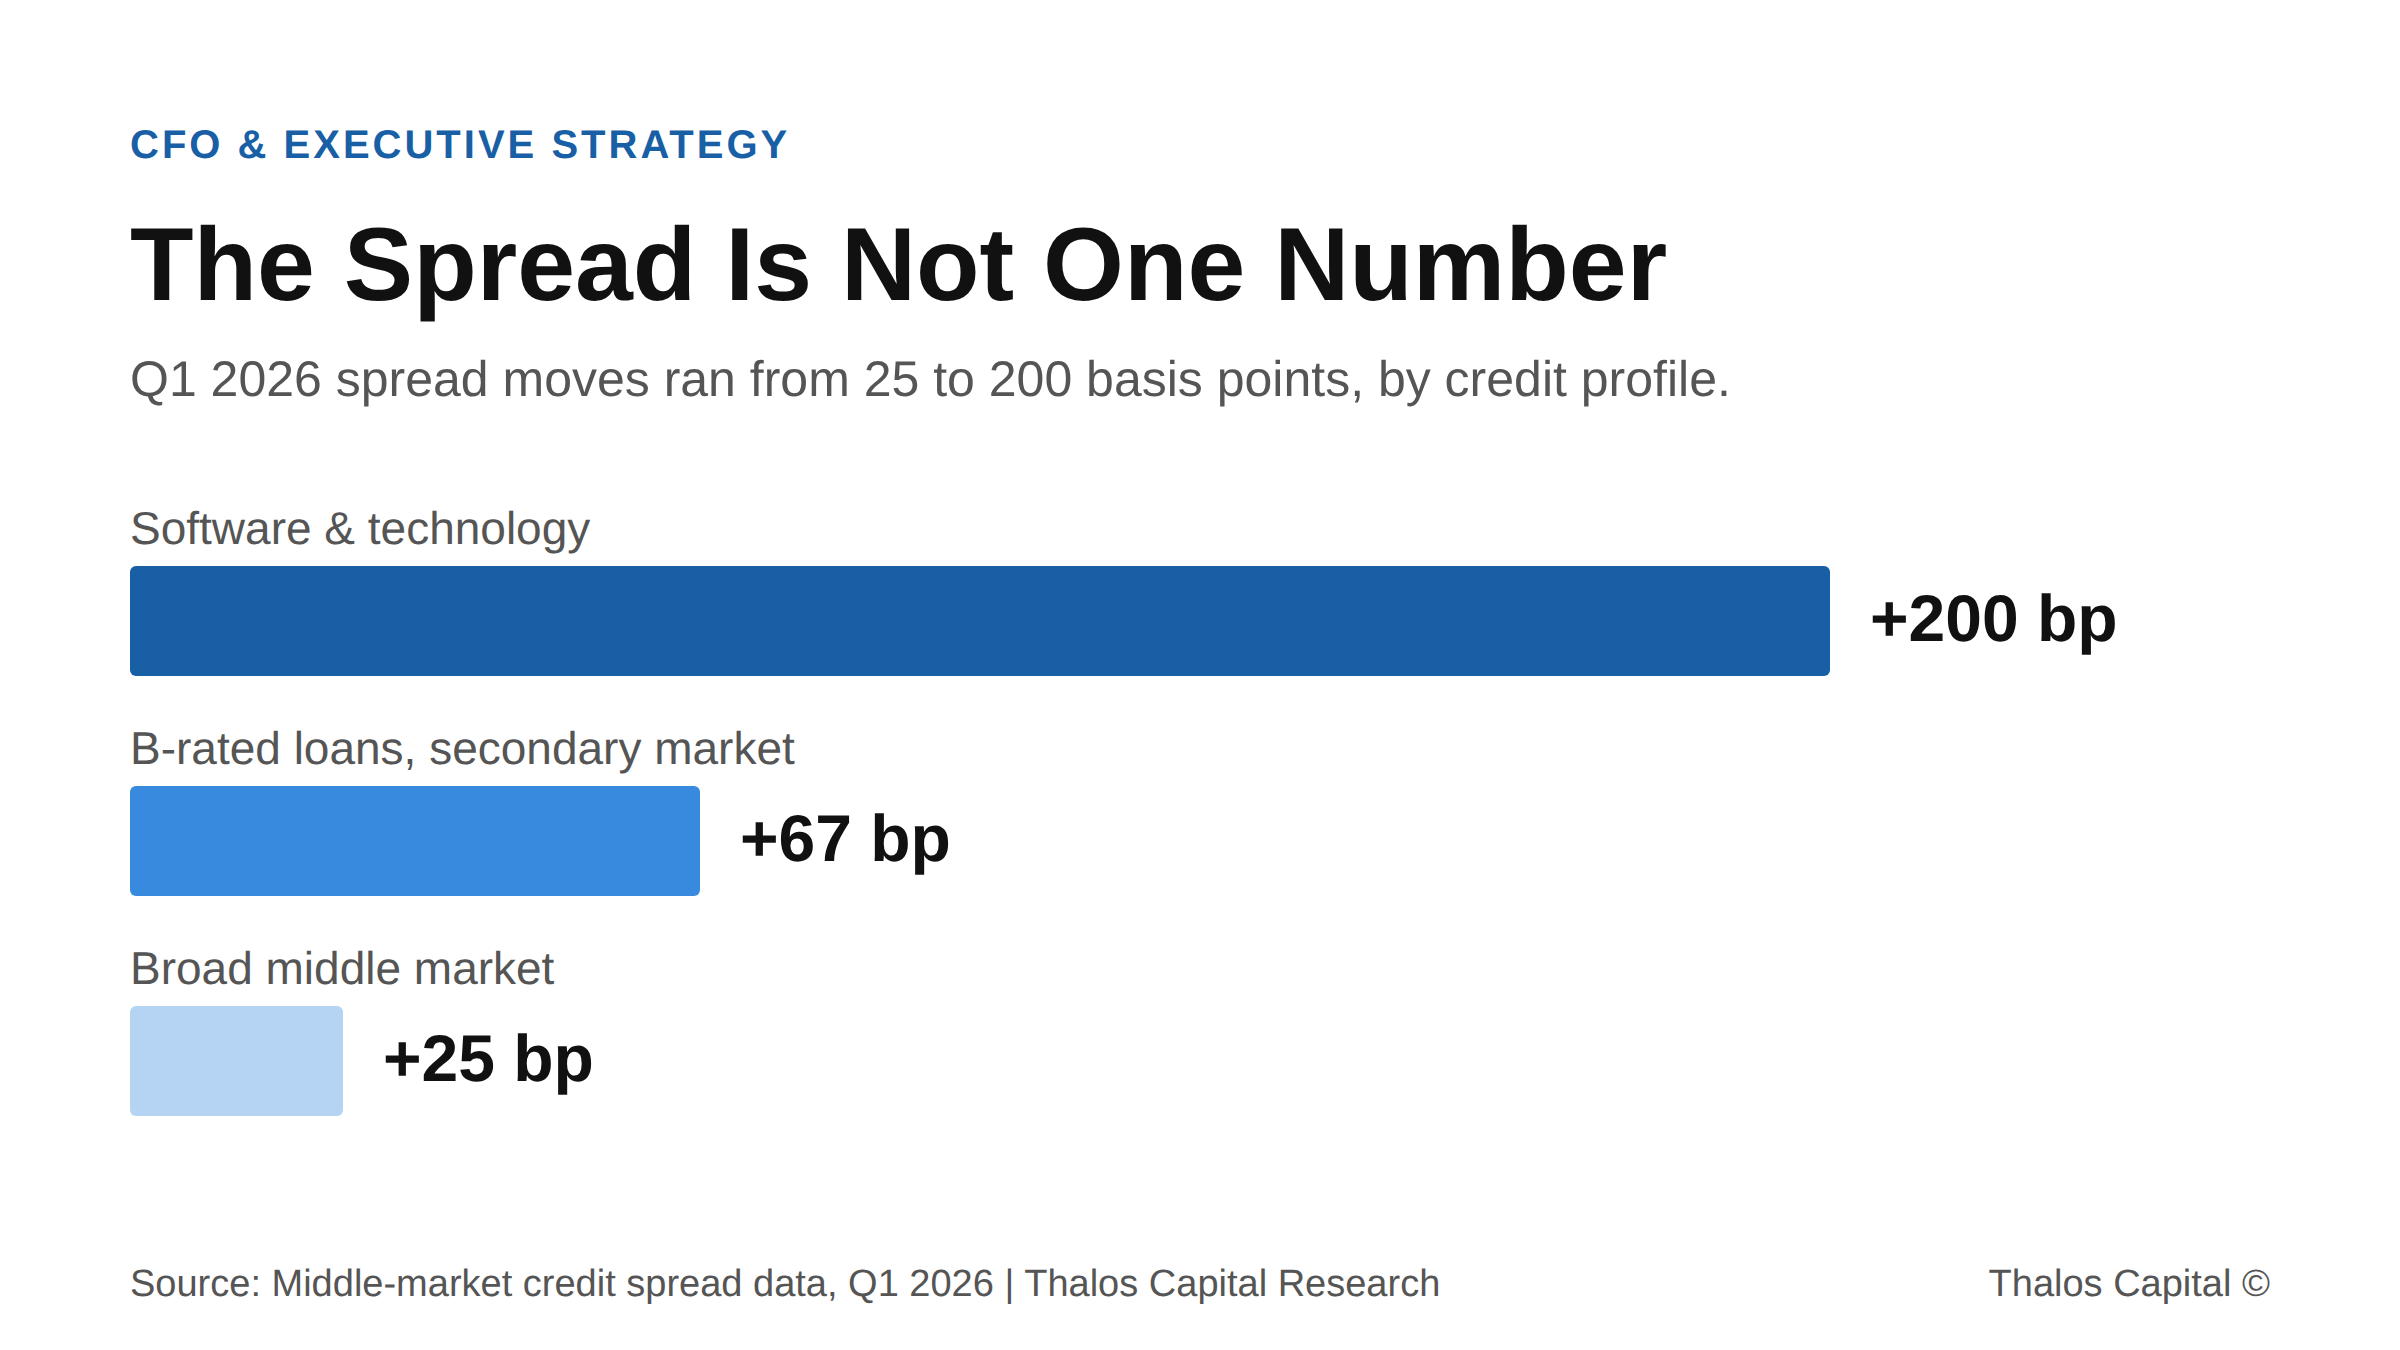
Horizontal bar chart of Q1 2026 middle-market spread moves of 25, 67, and 200 basis points by credit profile.

Lowest Rate, Worst Deal: Why Structure Beats Spread in This Credit Market

The cheapest quoted rate is rarely the lowest cost of capital. With Q1 2026 spreads ranging 25 to 200 bp, structure, not headline spread, decides what a facility actually costs.
Read More
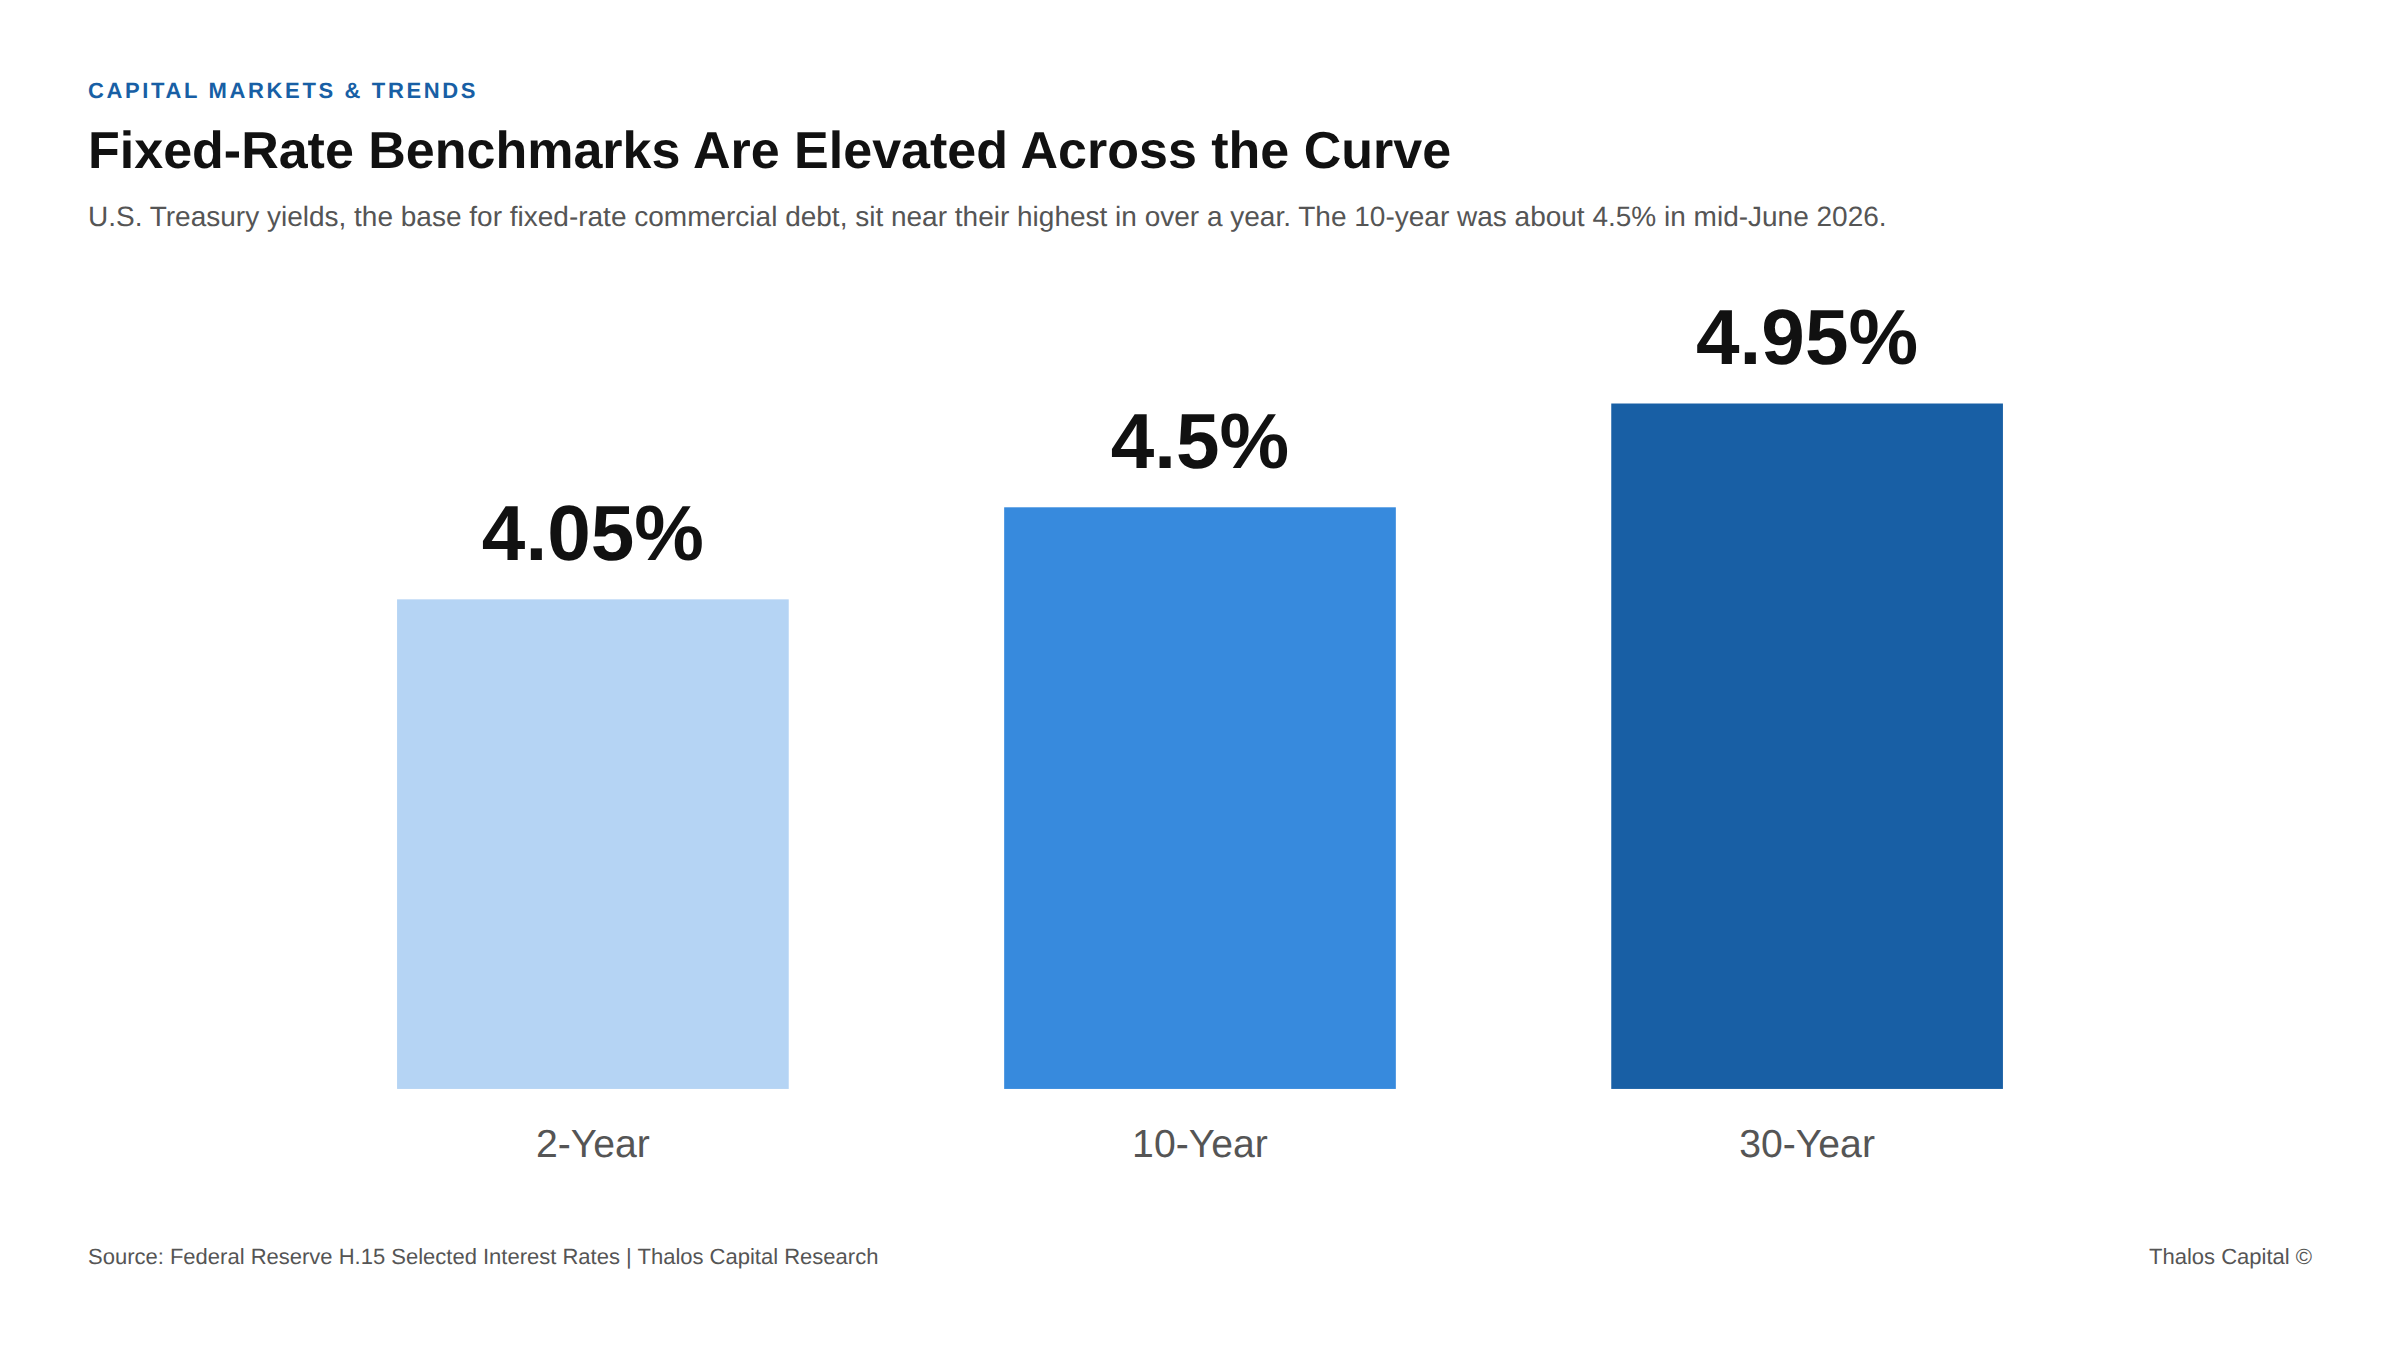
Bar chart of U.S. Treasury yields by maturity in mid-June 2026 showing the 2-year at 4.05 percent, 10-year at 4.5 percent, and 30-year at 4.95 percent

The 10-Year Just Hit a One-Year High. Waiting for Lower Fixed Rates Is Now a Bet Against the Curve.

The 10-year Treasury hit a one-year high while markets price the Fed to hold or hike. Why waiting for lower fixed rates is now a bet against the curve, and how to decide structure first.
Read More
Working through a financing decision?
Insights are a starting point. A conversation maps your actual options.
Tell us what you are financing and we will map the structures and sources that fit.
Submit your financing request →
Explore our financing solutions
Equipment FinancingWorking CapitalAsset-Based LendingStrategic Debt