Tag

middle market financing

2 insights

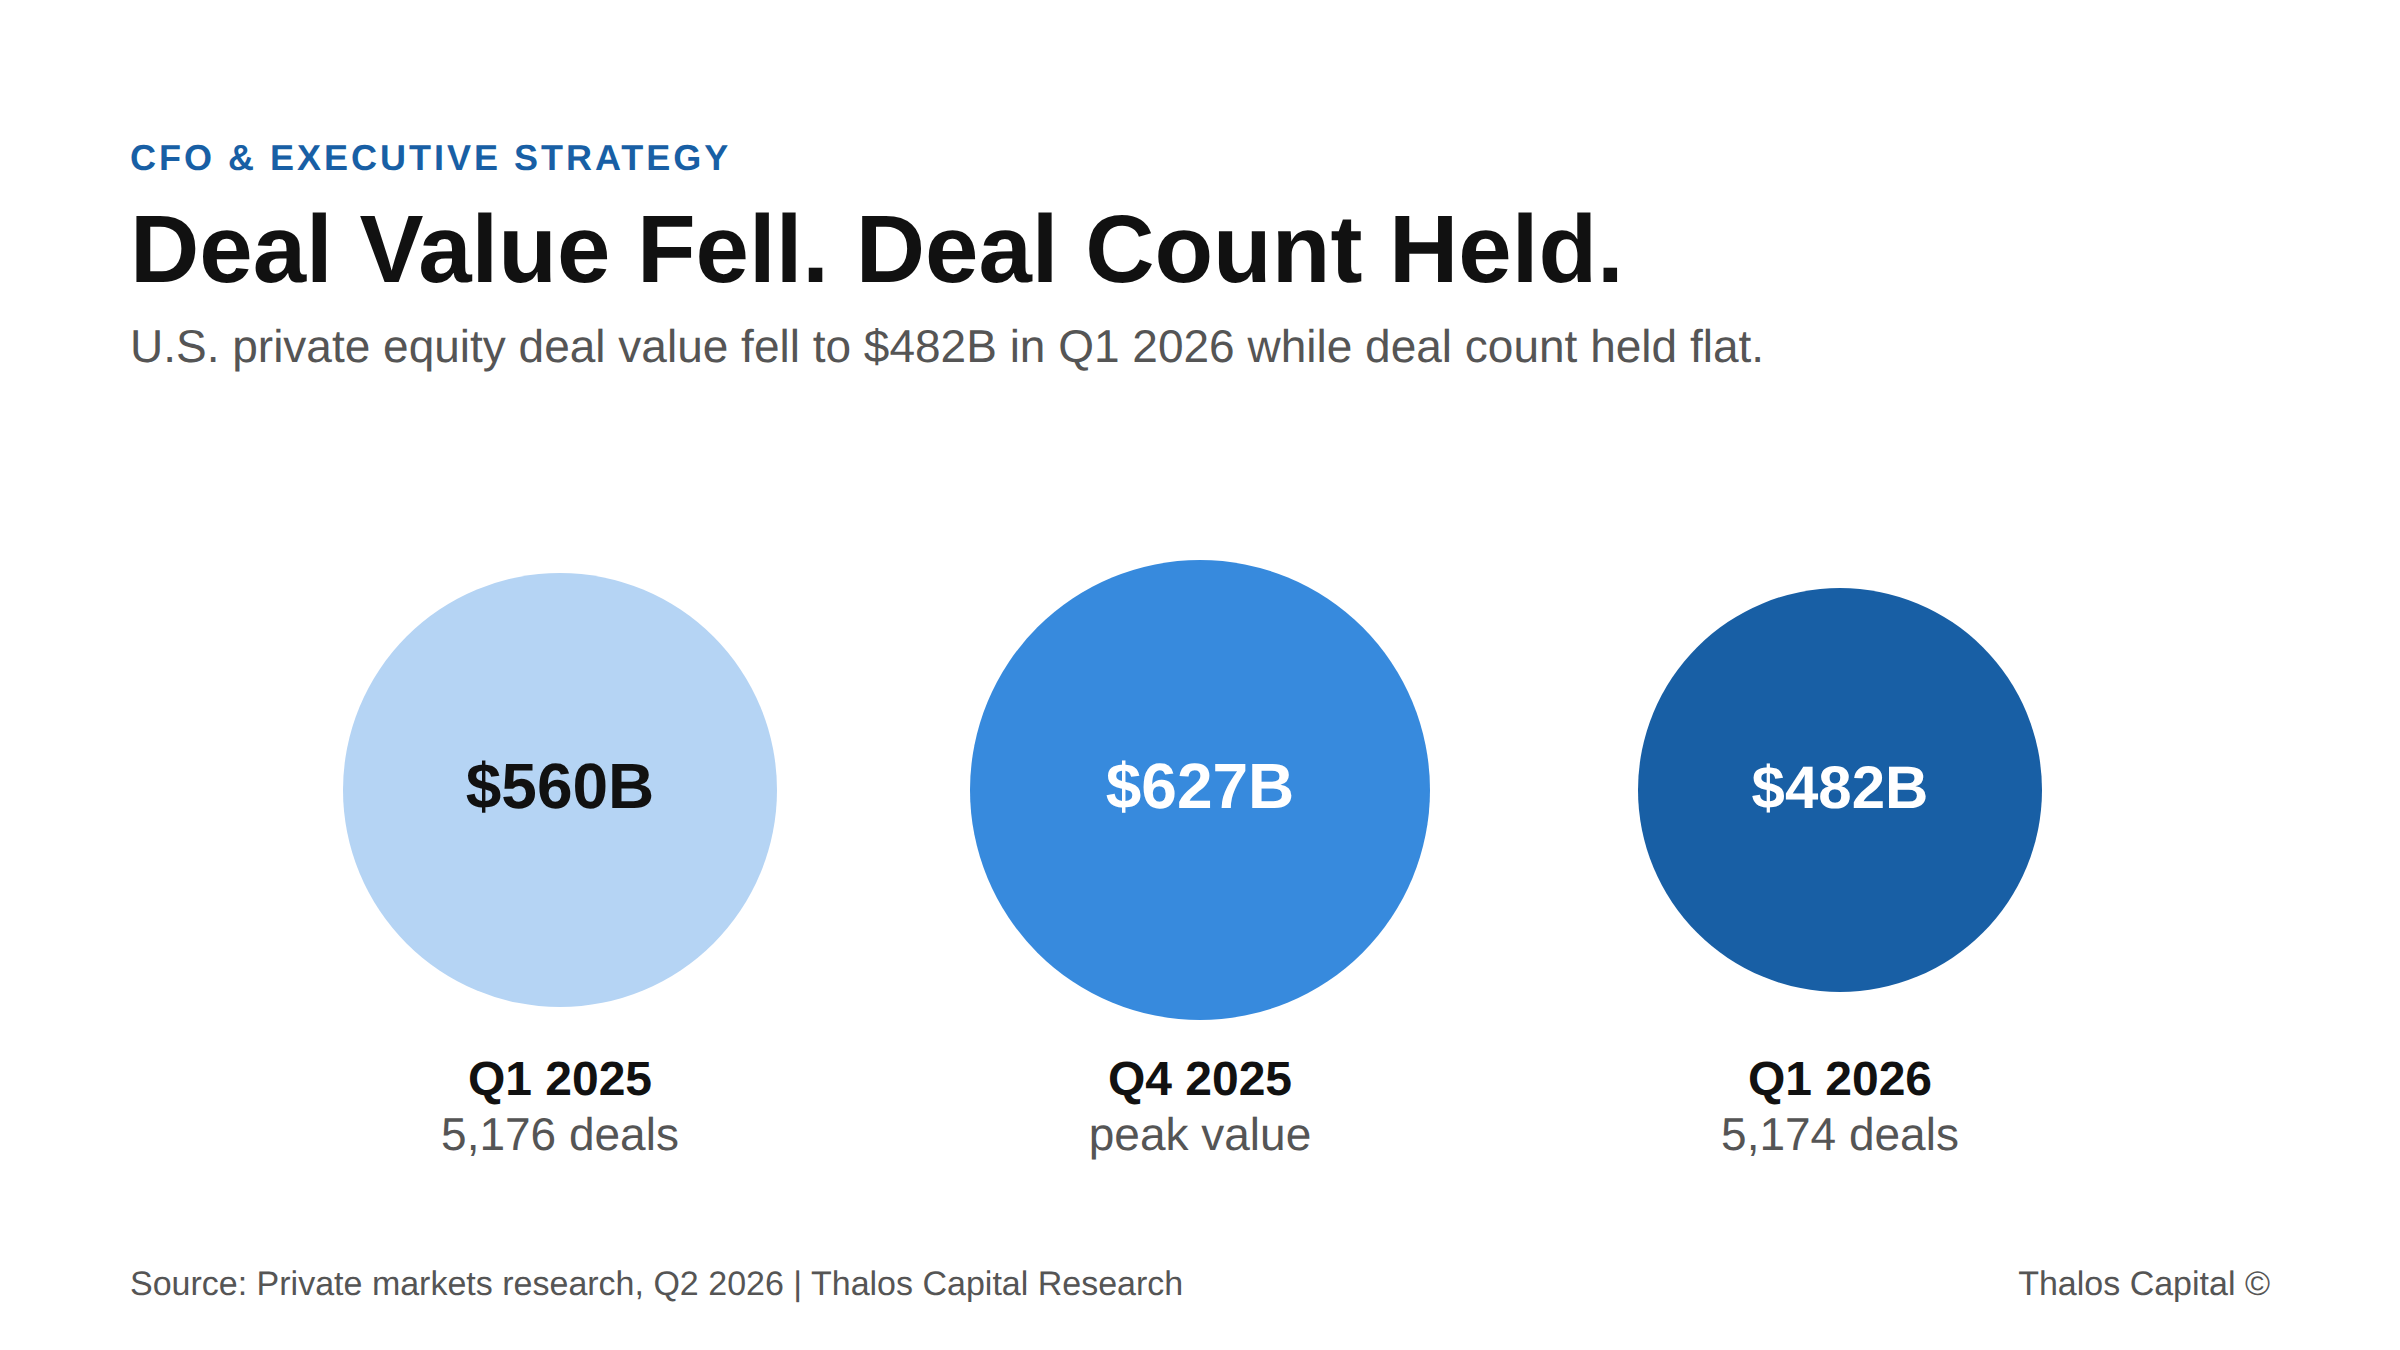
Proportional circle chart showing U.S. private equity deal value falling to $482B in Q1 2026 from $627B in Q4 2025 while deal count held flat near 5,175.

Capital Is Available. That Does Not Mean Your Deal Gets Funded.

Private equity deal value fell 14% year over year while deal count stayed flat. In a selective market, readiness, not access, decides which borrowers actually get funded.
Read More
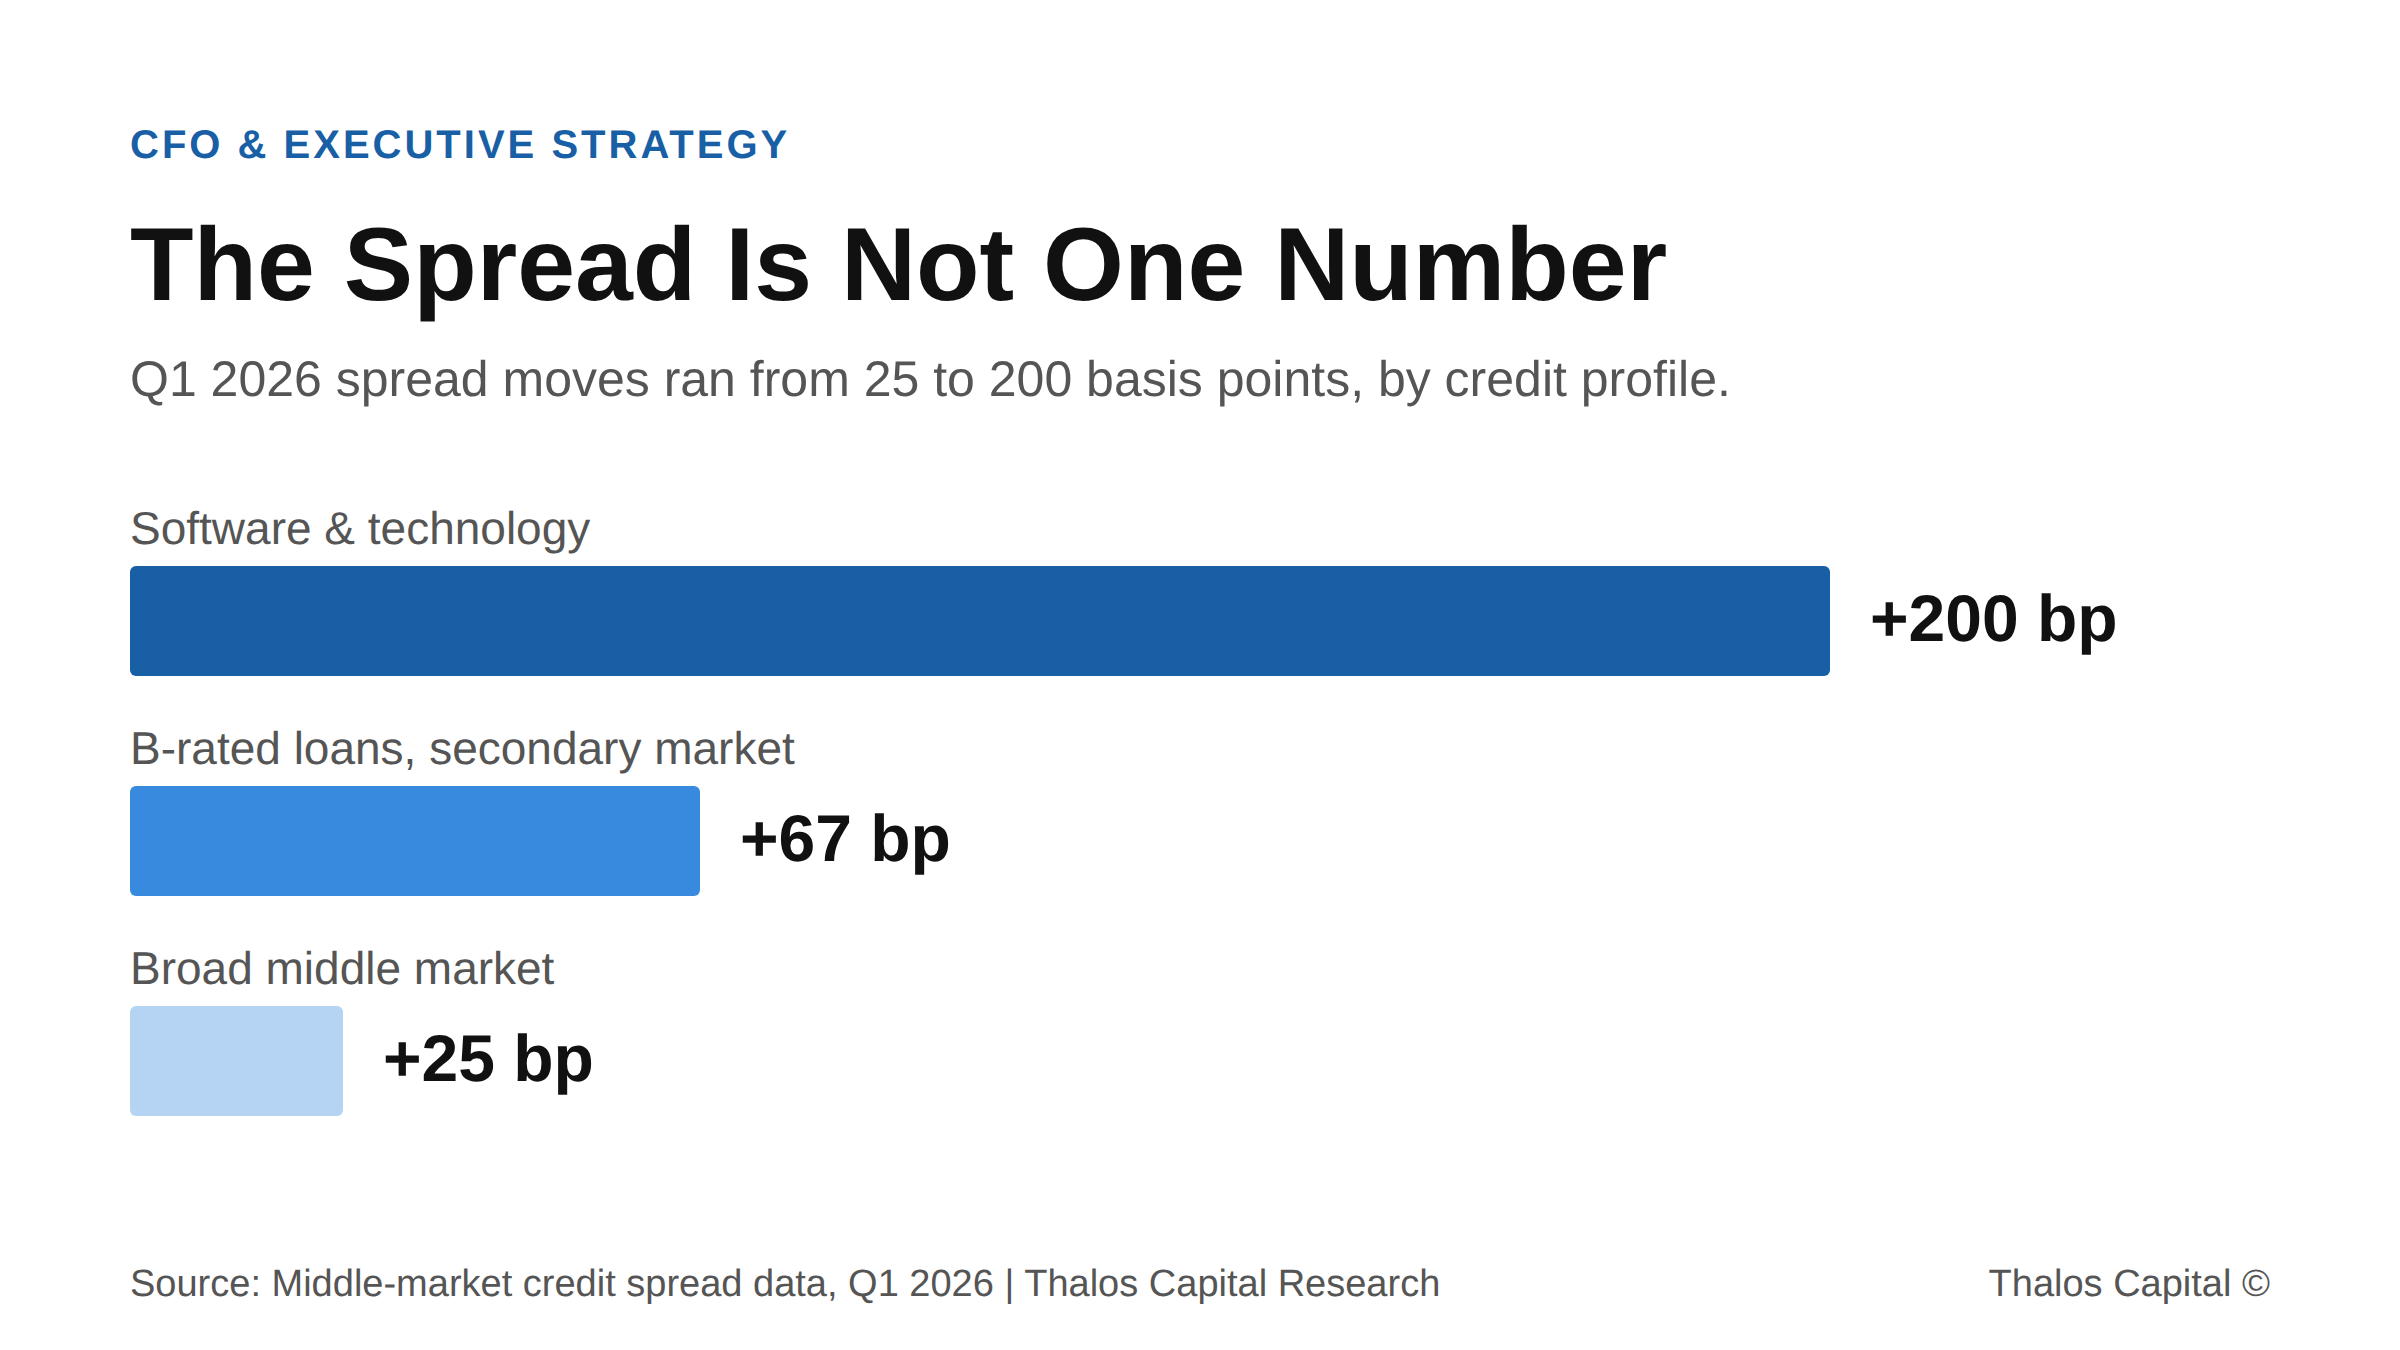
Horizontal bar chart of Q1 2026 middle-market spread moves of 25, 67, and 200 basis points by credit profile.

Lowest Rate, Worst Deal: Why Structure Beats Spread in This Credit Market

The cheapest quoted rate is rarely the lowest cost of capital. With Q1 2026 spreads ranging 25 to 200 bp, structure, not headline spread, decides what a facility actually costs.
Read More
Working through a financing decision?
Insights are a starting point. A conversation maps your actual options.
Tell us what you are financing and we will map the structures and sources that fit.
Submit your financing request →
Explore our financing solutions
Equipment FinancingWorking CapitalAsset-Based LendingStrategic Debt