Tag

financing strategy

3 insights

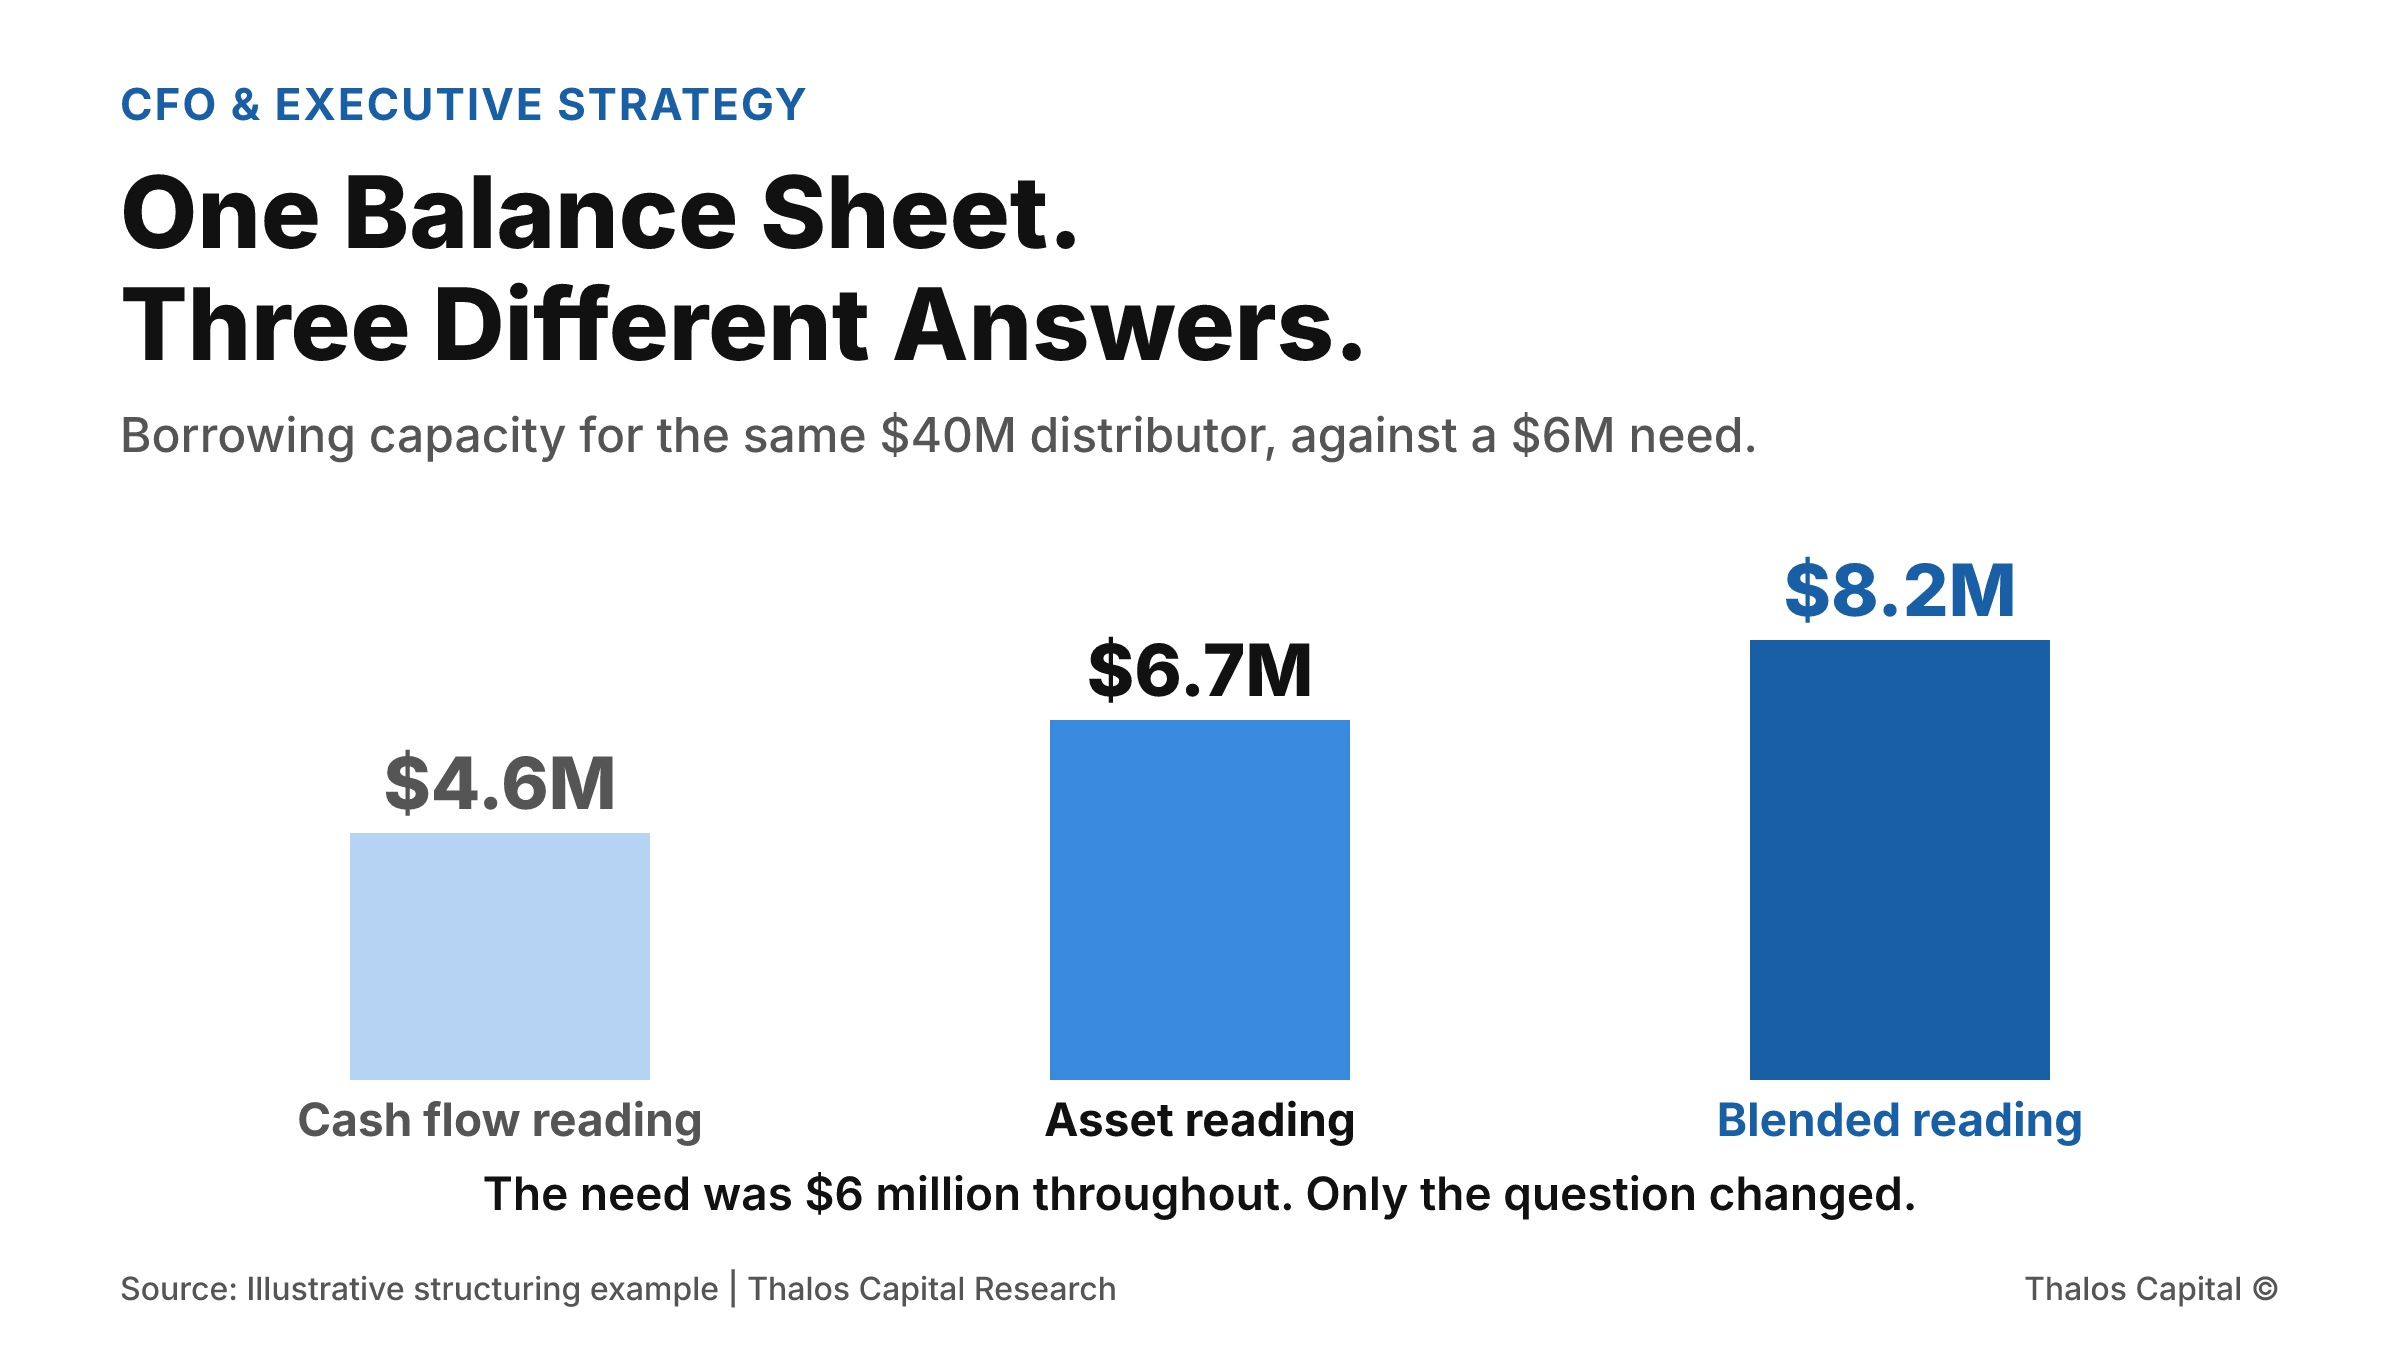
Column chart showing three borrowing capacity readings for the same distributor: $4.6 million on a cash flow reading, $6.7 million on an asset reading, and $8.2 million on a blended reading shown in the darkest navy, against a $6 million financing need.

One Balance Sheet. Three Different Answers.

A distributor doing $40 million in revenue needs $6 million. Read against cash flow it is short. Read against its assets it clears. Read as a blend it borrows $8.2 million. Same company, same week, three answers.
Read More
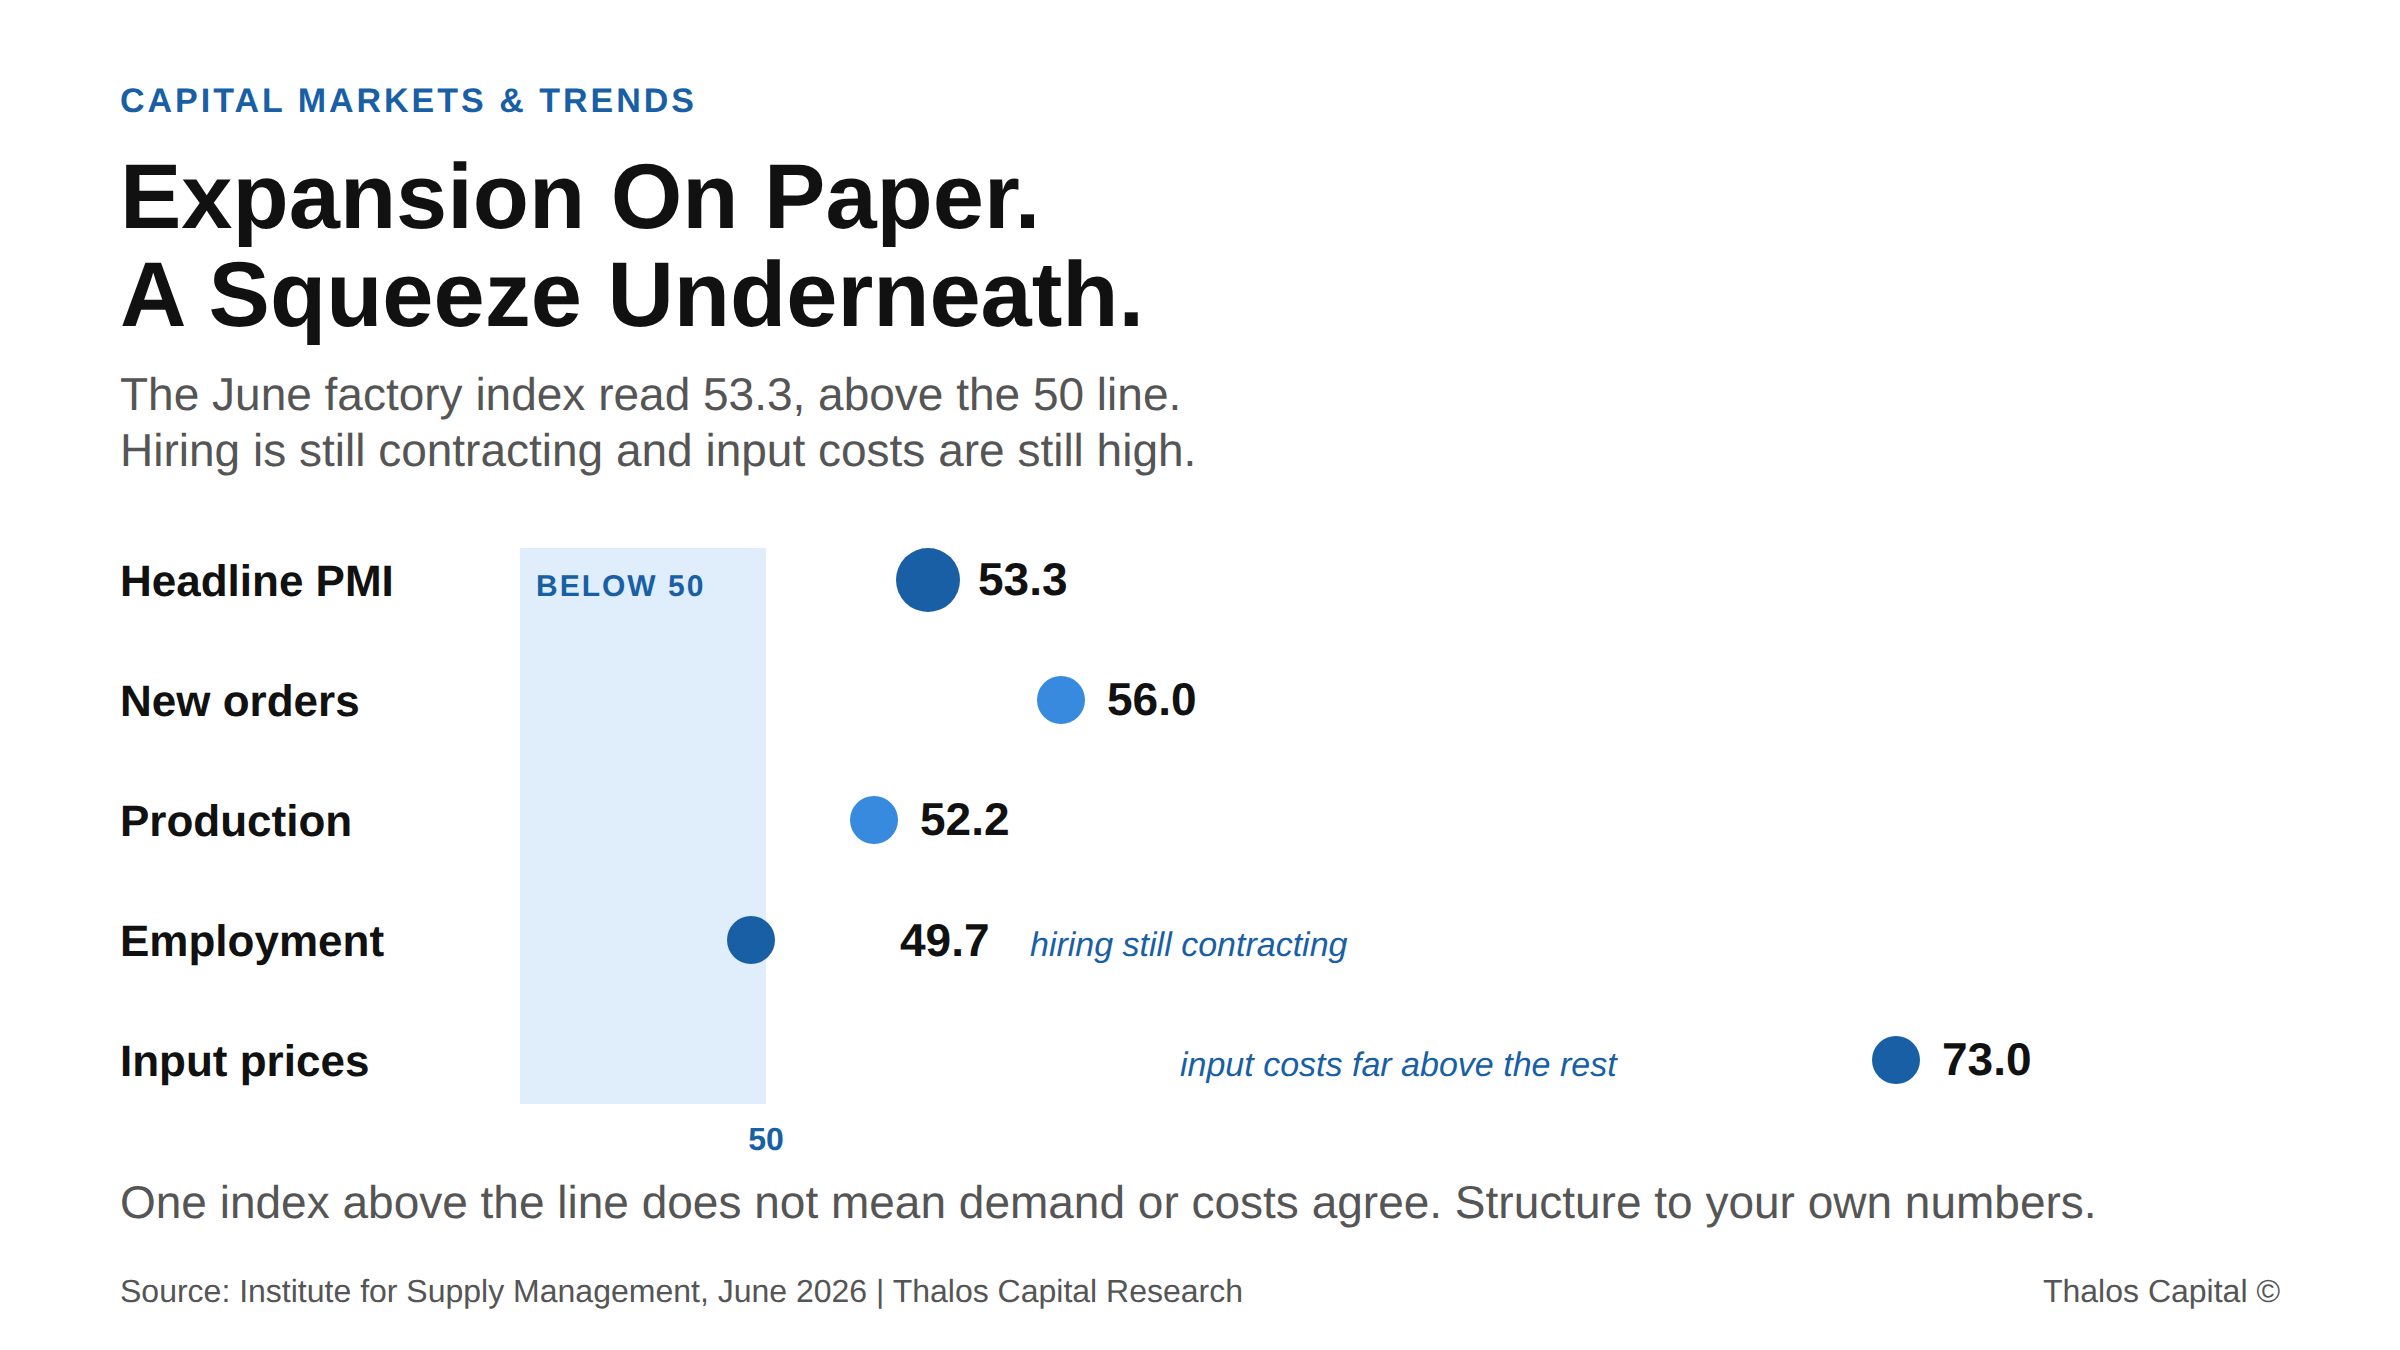
Dot plot of June 2026 factory index components showing headline PMI at 53.3 above the 50 line while employment sits at 49.7 in contraction and input prices at 73.0 remain elevated.

Expansion On Paper. A Squeeze Underneath.

A factory index above 50 reads as a growth signal, but hiring is still contracting and input costs are still high. Why financing sized to the headline misreads a margin story as a volume story.
Read More
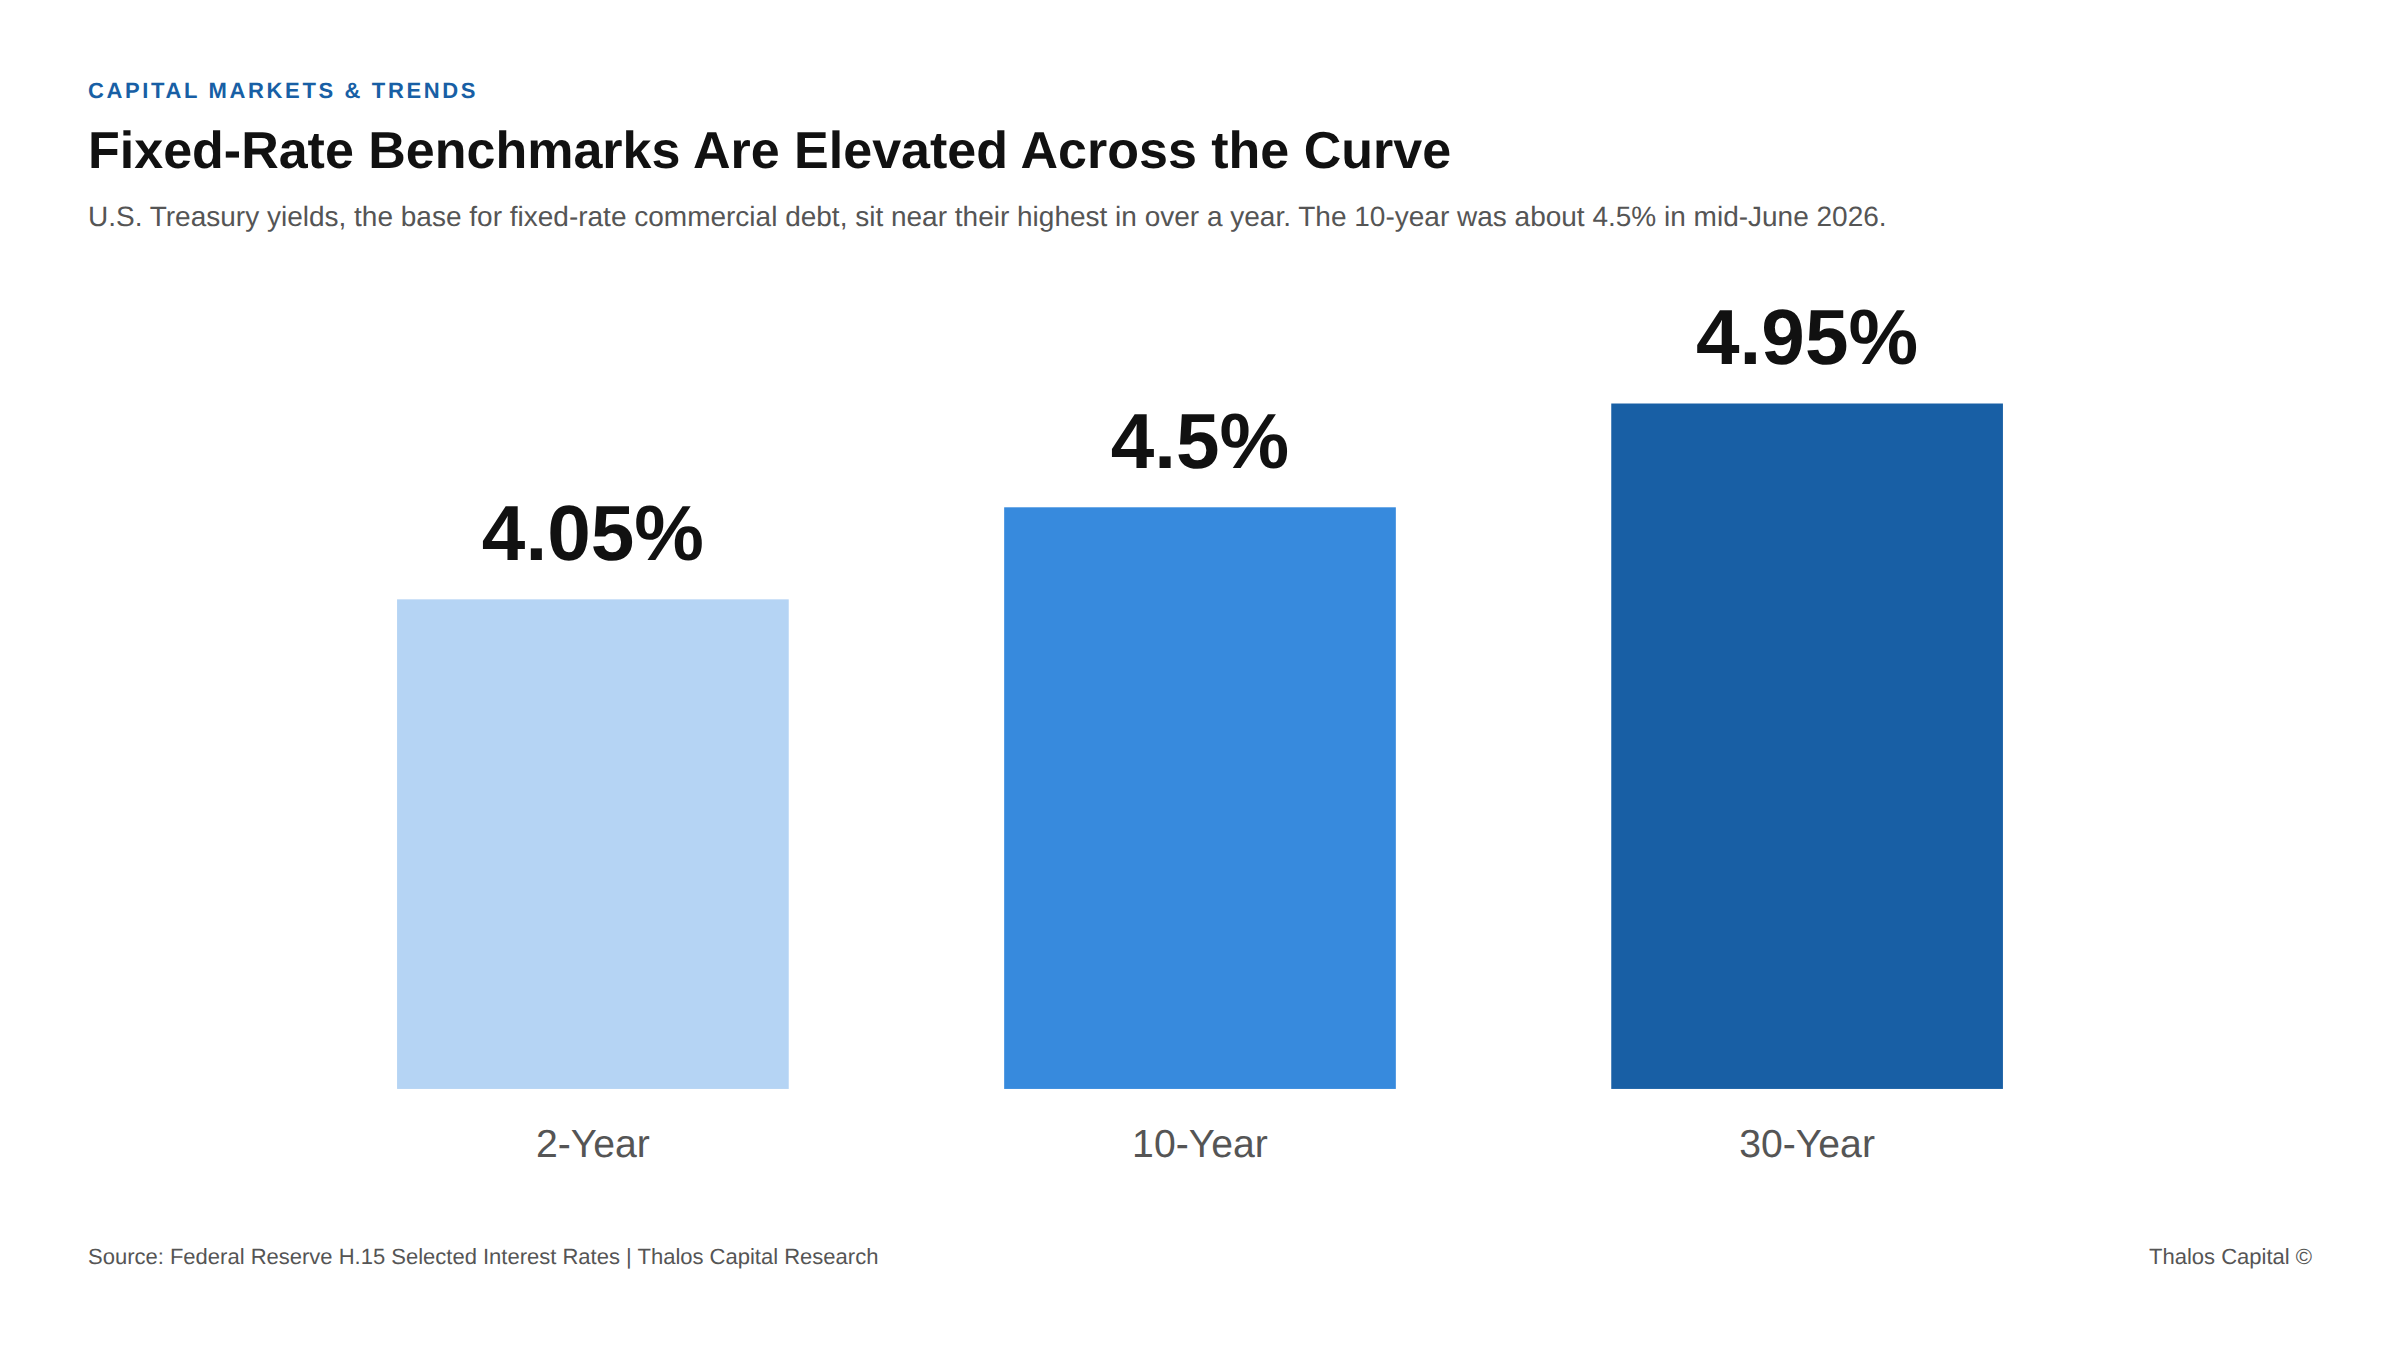
Bar chart of U.S. Treasury yields by maturity in mid-June 2026 showing the 2-year at 4.05 percent, 10-year at 4.5 percent, and 30-year at 4.95 percent

The 10-Year Just Hit a One-Year High. Waiting for Lower Fixed Rates Is Now a Bet Against the Curve.

The 10-year Treasury hit a one-year high while markets price the Fed to hold or hike. Why waiting for lower fixed rates is now a bet against the curve, and how to decide structure first.
Read More
Working through a financing decision?
Insights are a starting point. A conversation maps your actual options.
Tell us what you are financing and we will map the structures and sources that fit.
Submit your financing request →
Explore our financing solutions
Equipment FinancingWorking CapitalAsset-Based LendingStrategic Debt