Tag

debt capacity

4 insights

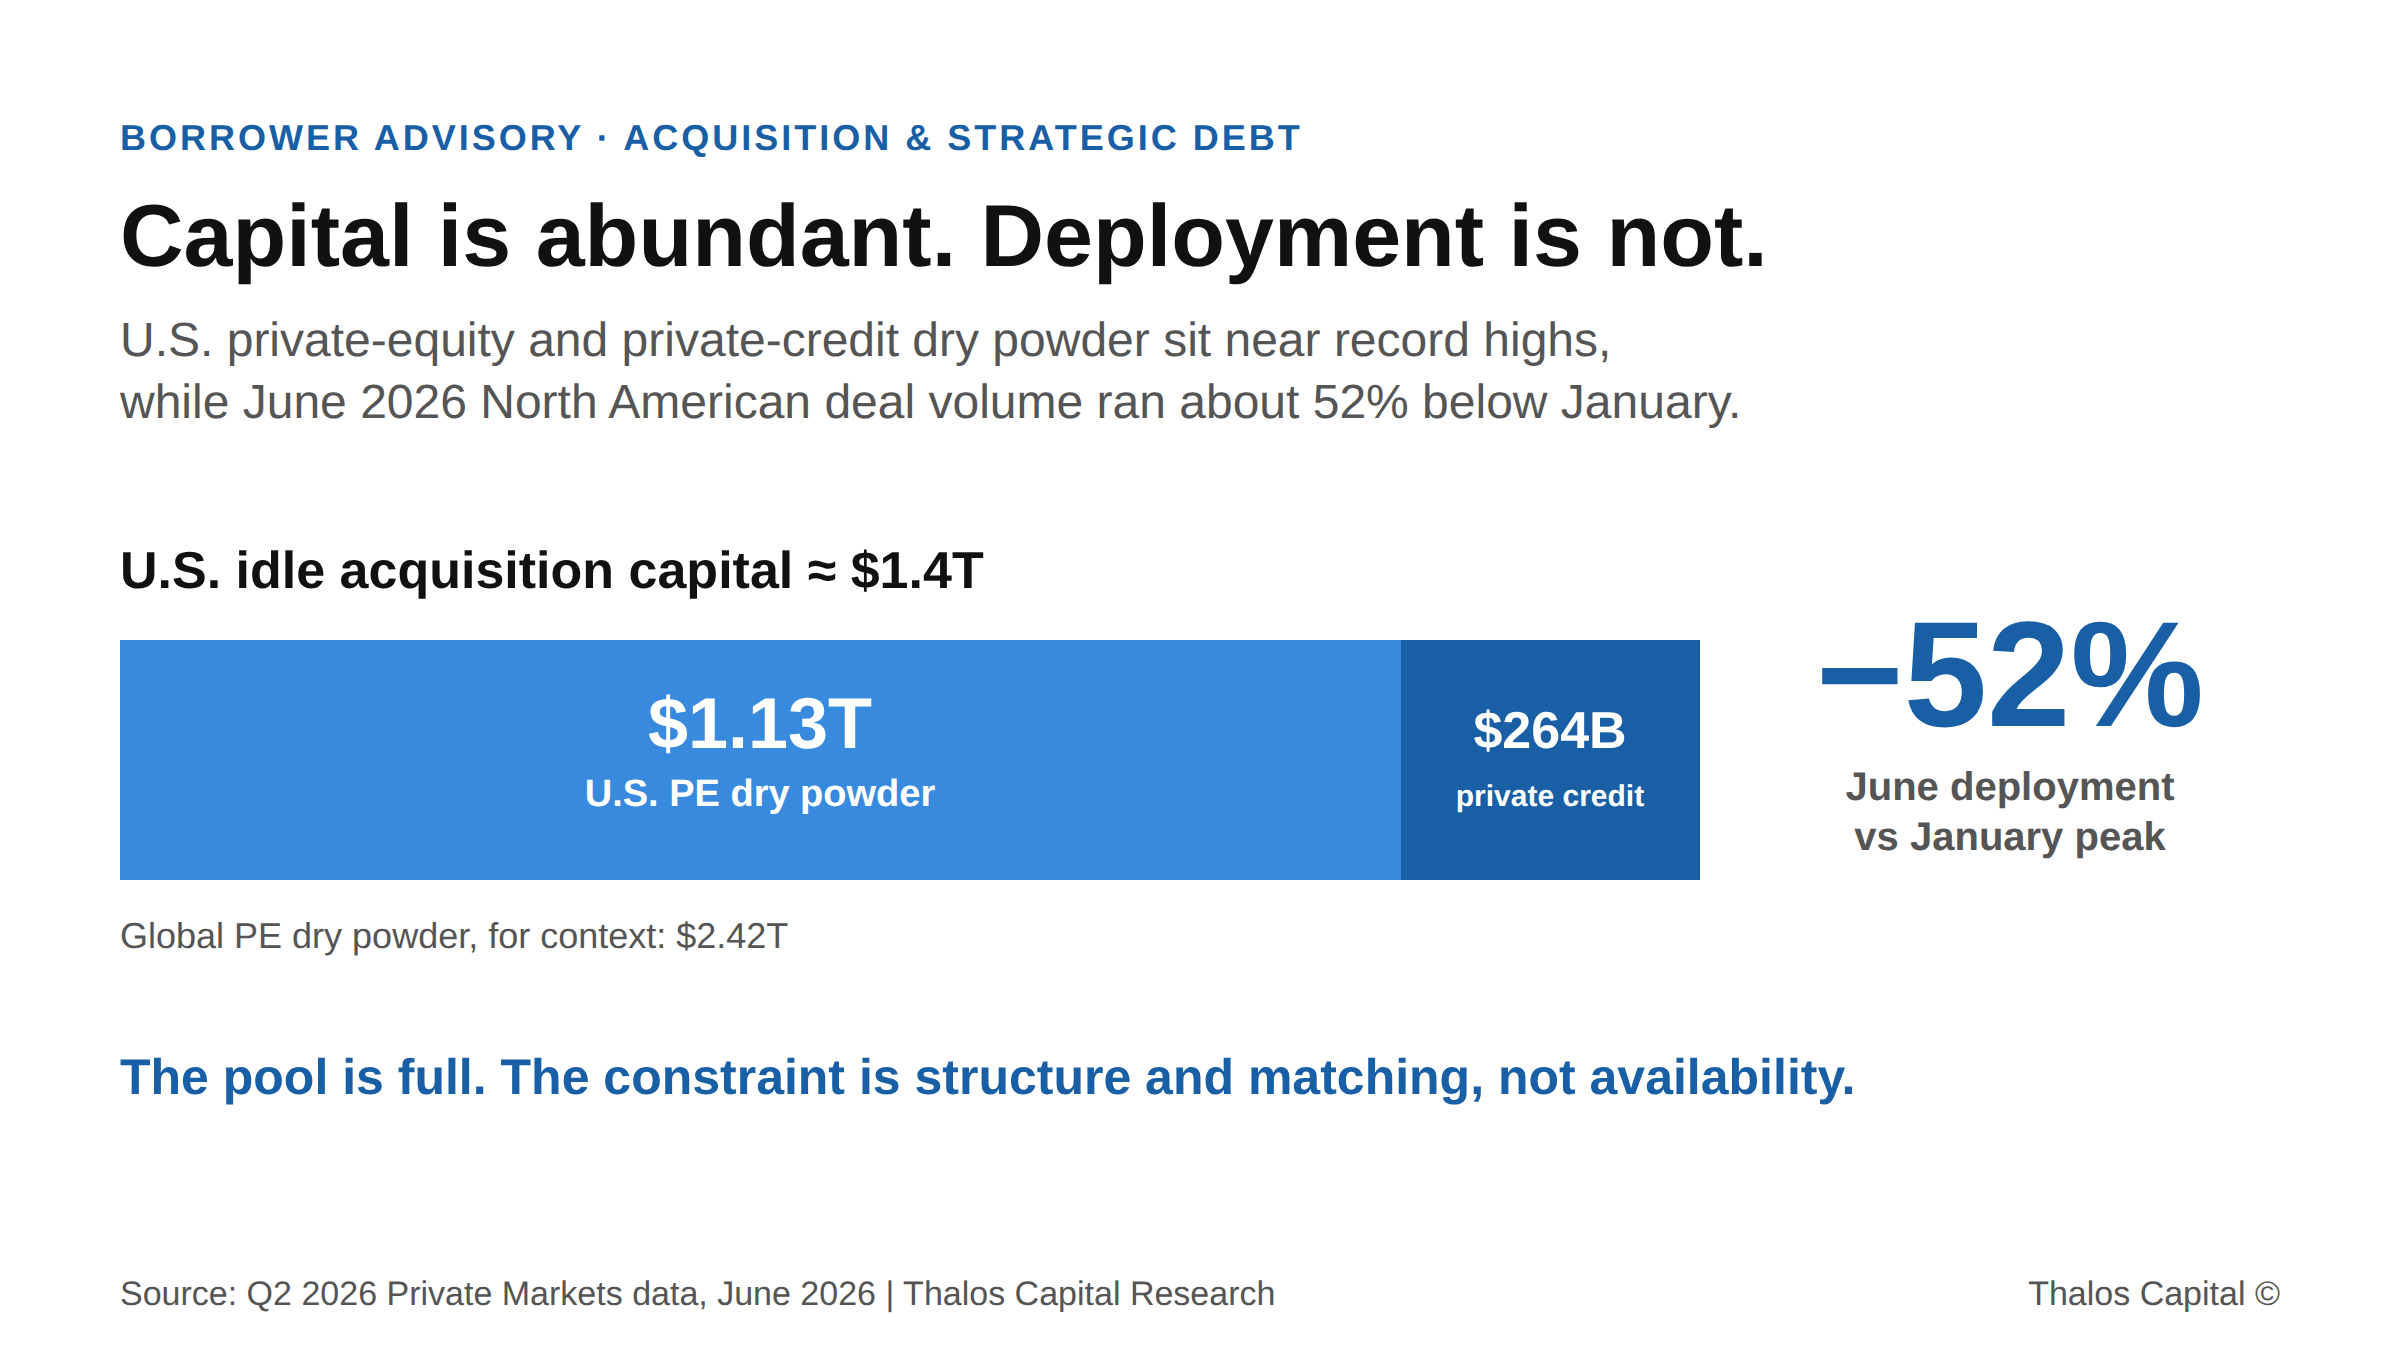
Horizontal stacked bar showing about $1.4T of idle U.S. acquisition capital, split into $1.13T PE dry powder and $264B private-credit dry powder, against a −52% drop in June 2026 deal deployment versus January.

Capital Is Not Scarce. It Is Just Not Moving.

U.S. acquisition capital sits near record levels while deal volume has fallen by half. The binding constraint for buyers now is structure and matching, not availability.
Read More
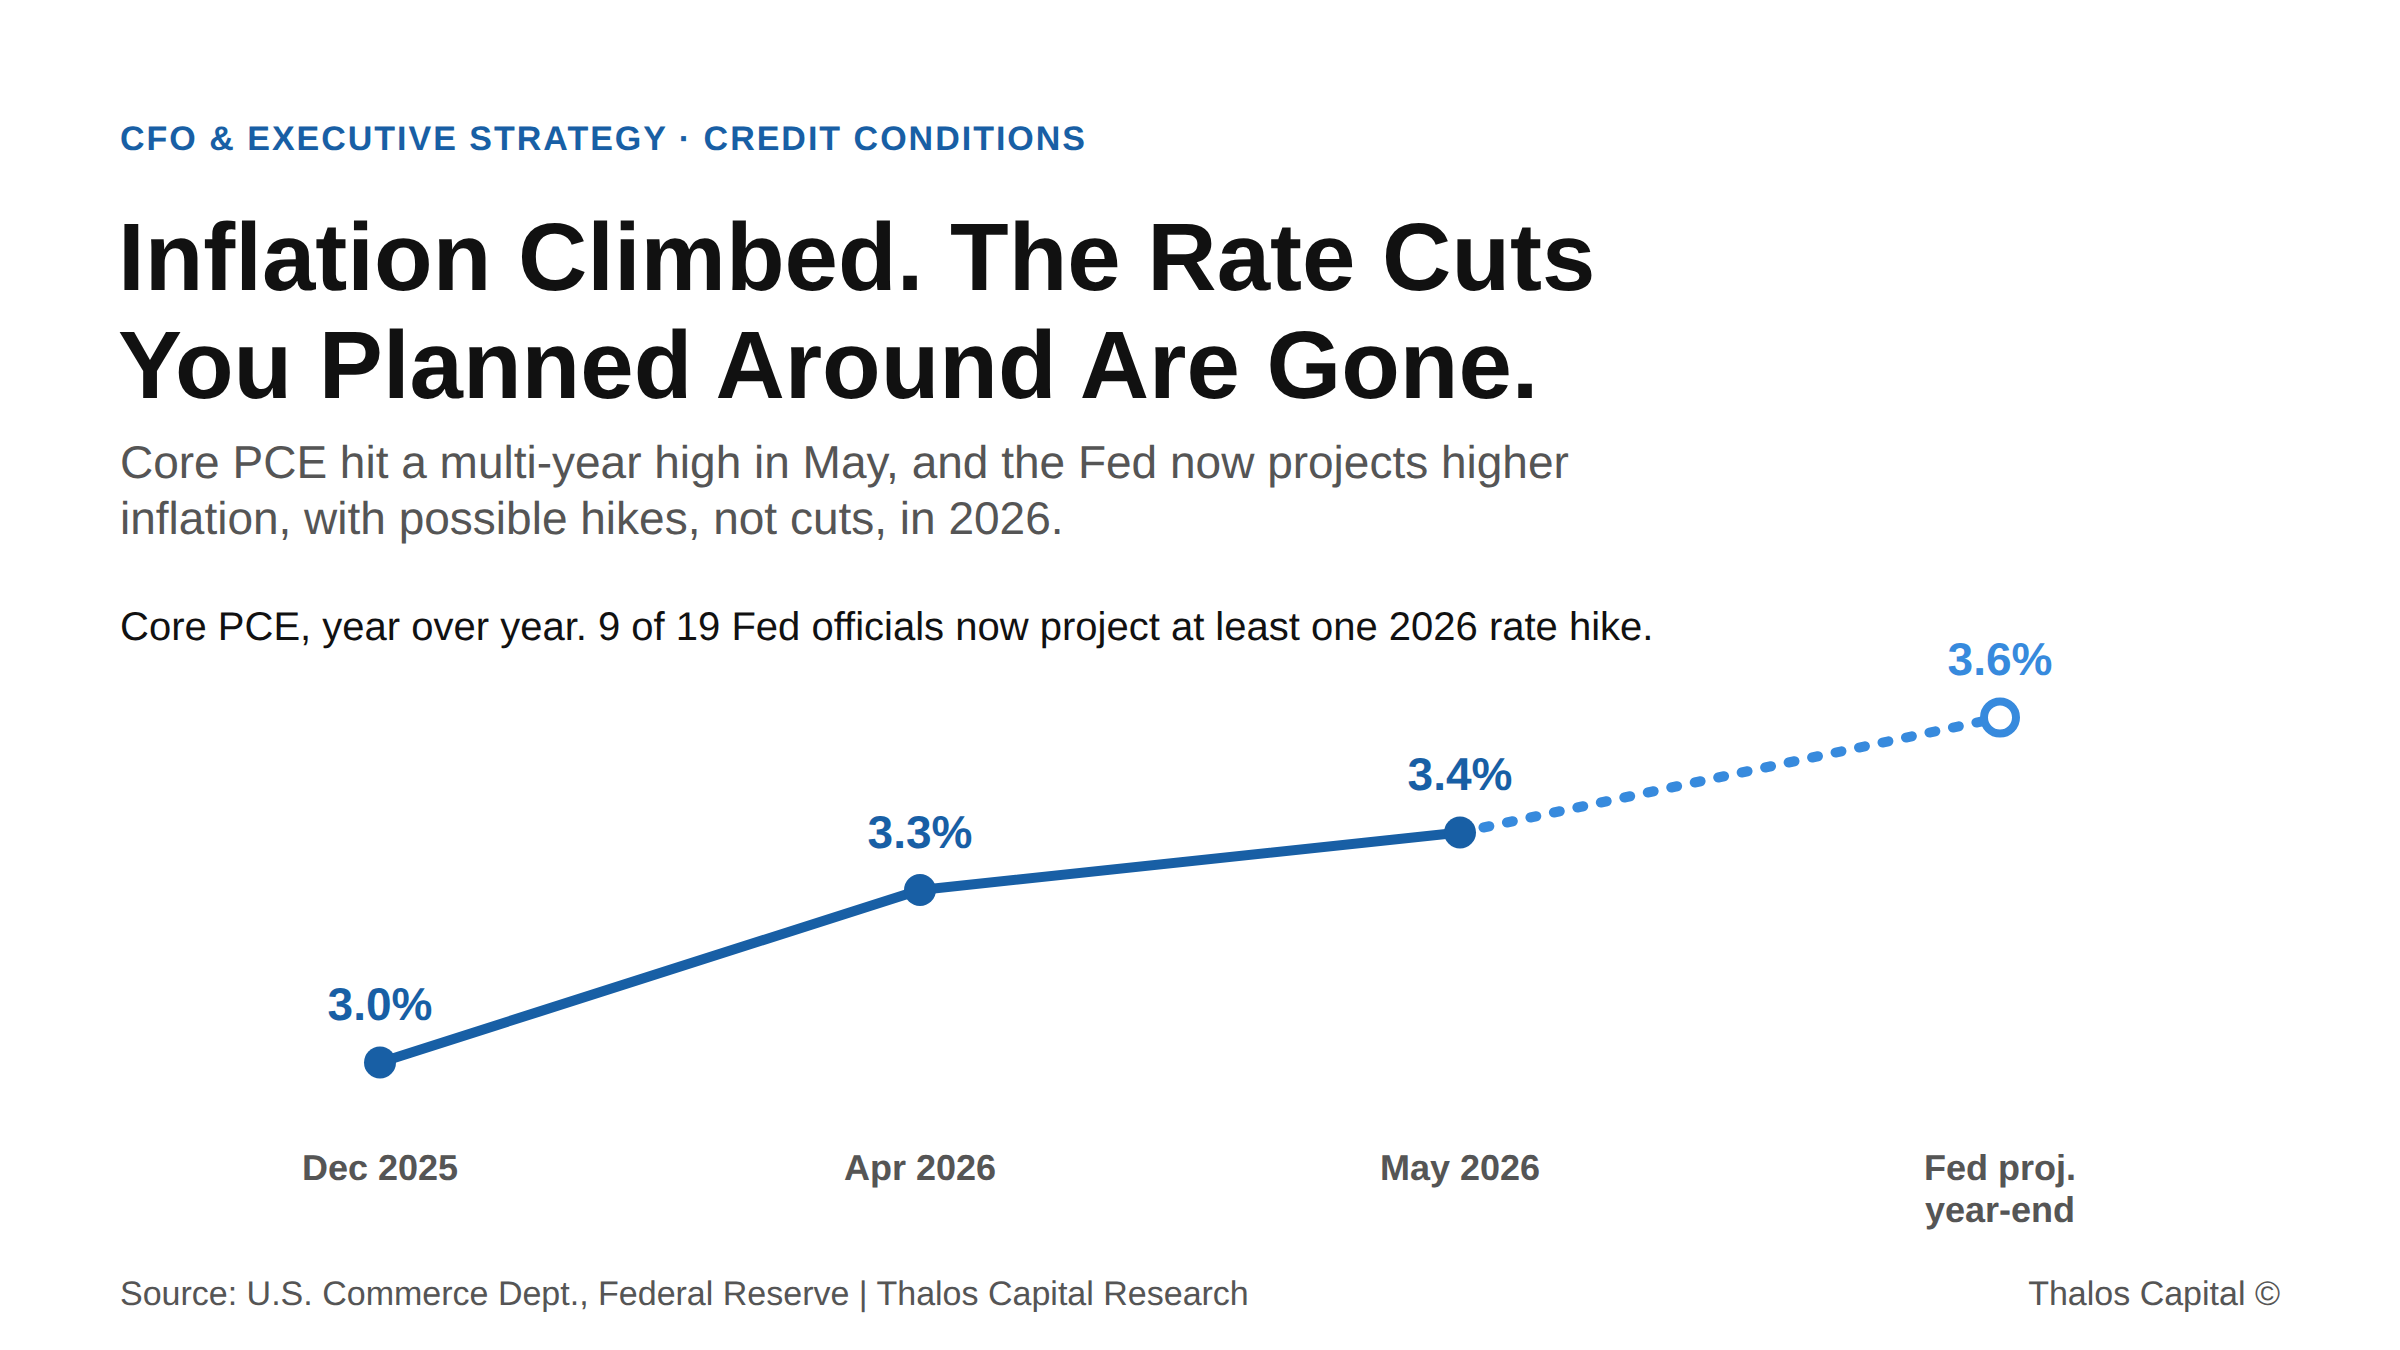
Line chart showing core PCE inflation rising from 3.0% in December 2025 to 3.4% in May 2026, with the Federal Reserve projecting 3.6% at year-end 2026.

Your Borrowing Capacity Is Shrinking While You Wait

The rate outlook flipped and commercial bankruptcy filings are climbing. Why the debt capacity you modeled last year is shrinking, and how to bring current assumptions to the lender call.
Read More
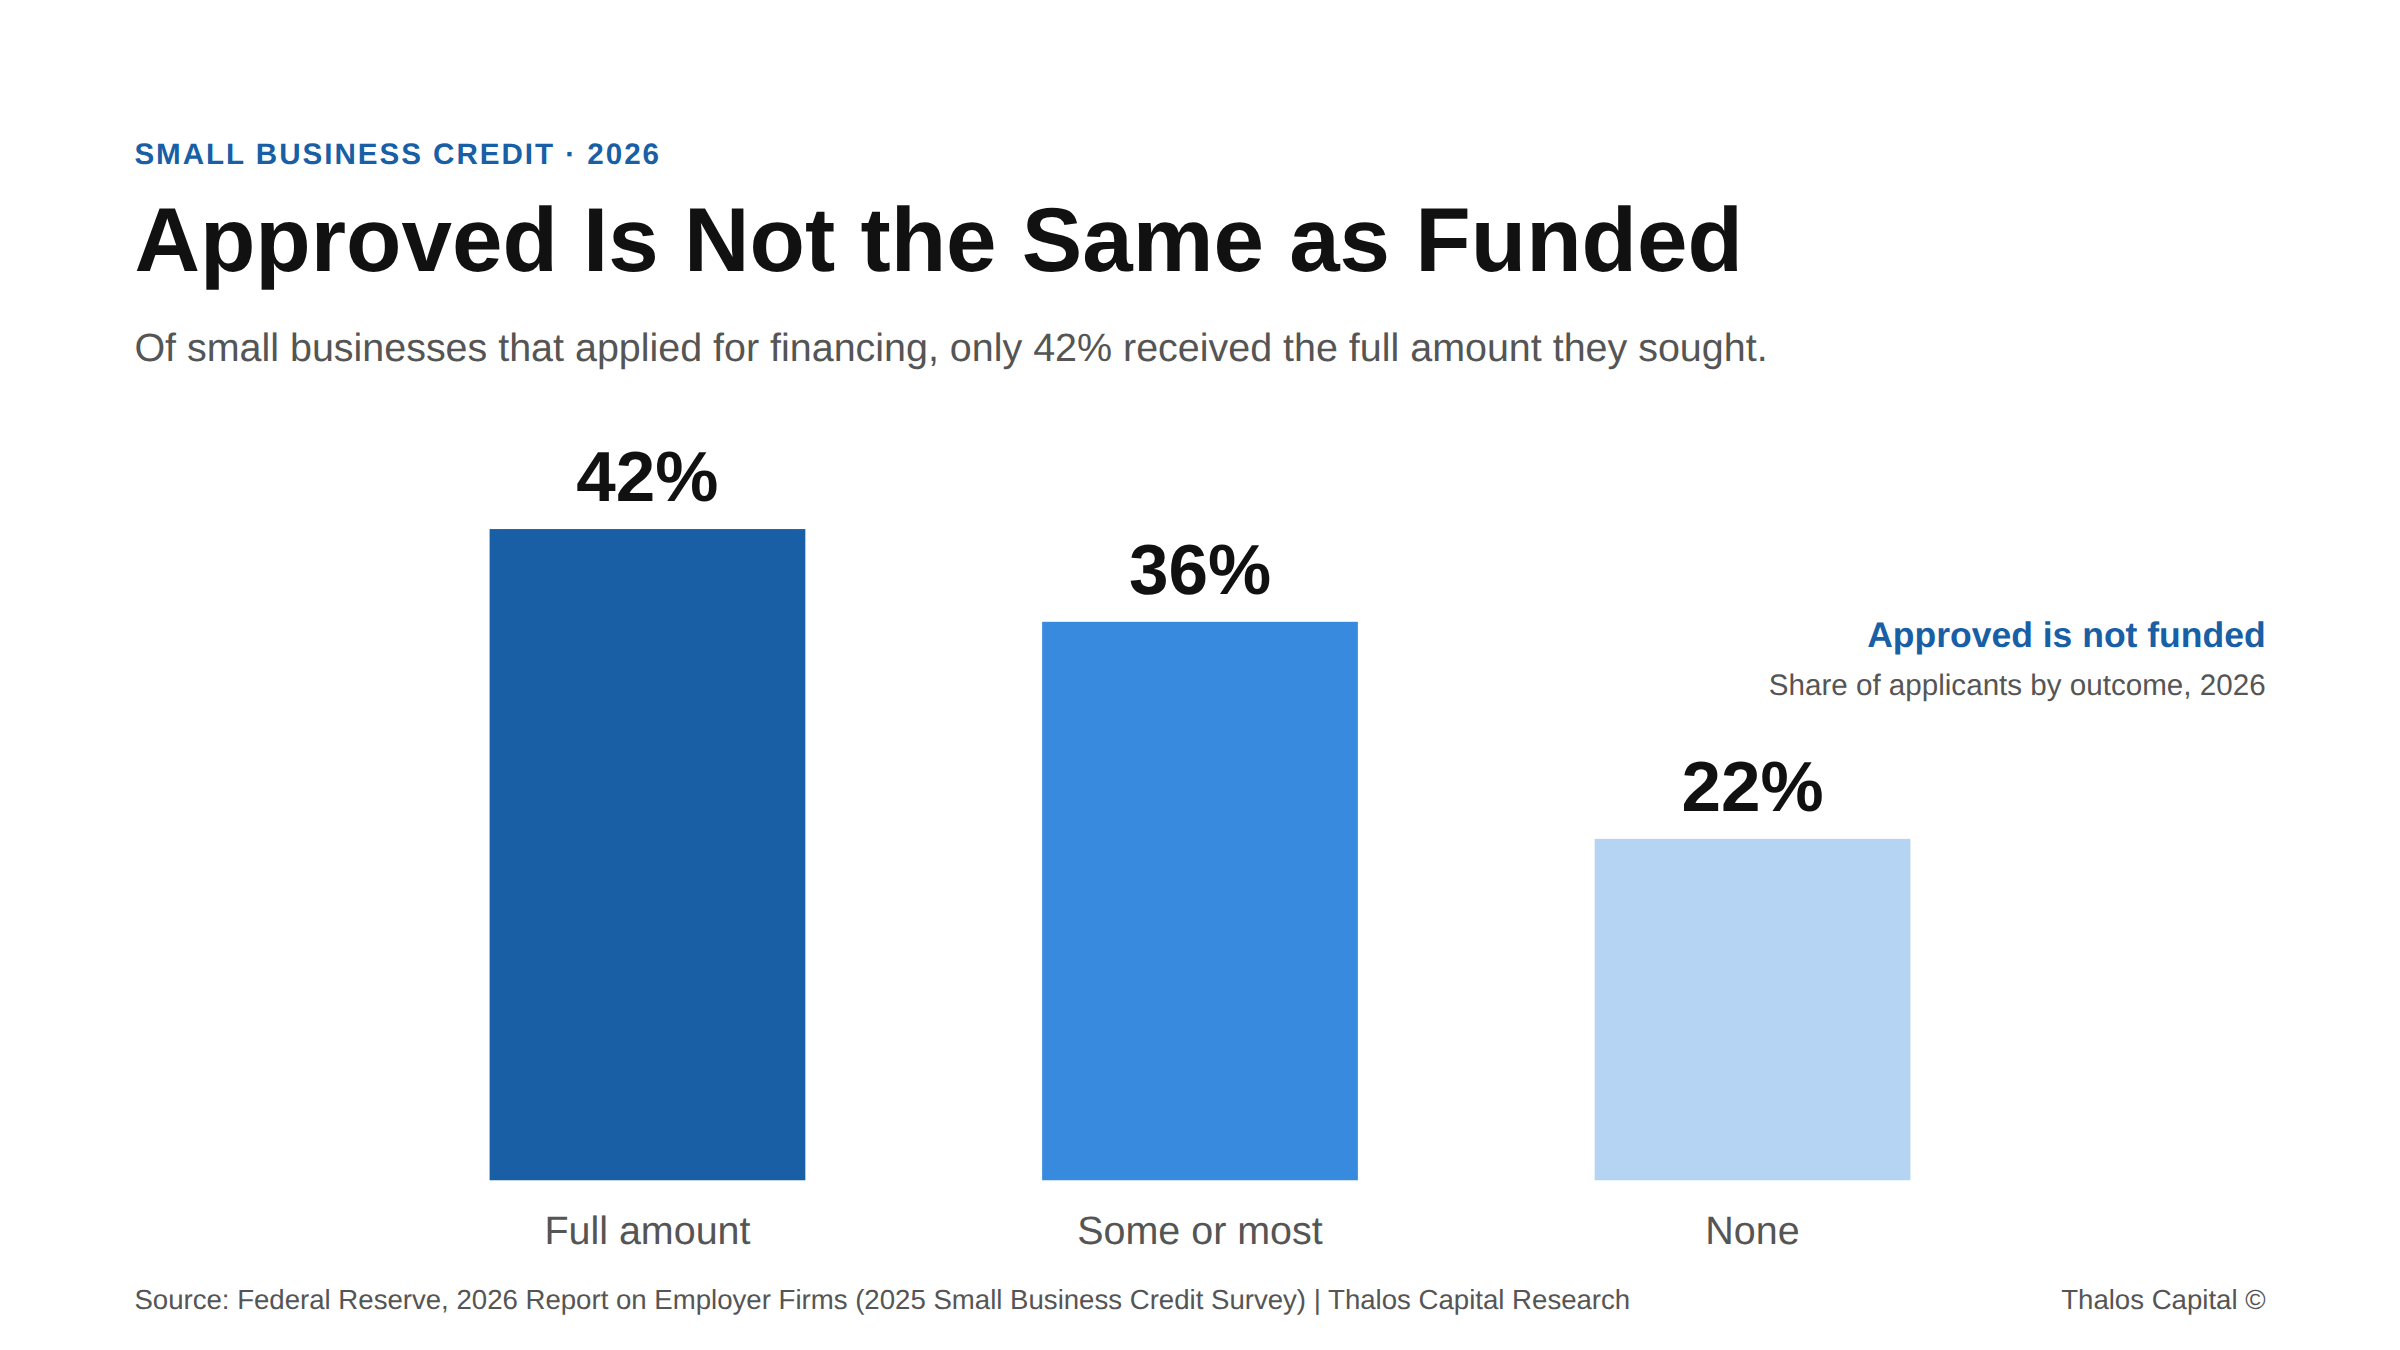
Bar chart showing 42 percent of small business financing applicants received the full amount, 36 percent some or most, 22 percent none.

Getting Approved Is Not Getting Funded: The 42% Problem

Only 42% of small businesses get the full financing they request. Why partial approval is the most expensive outcome, and what fully funded borrowers do differently.
Read More
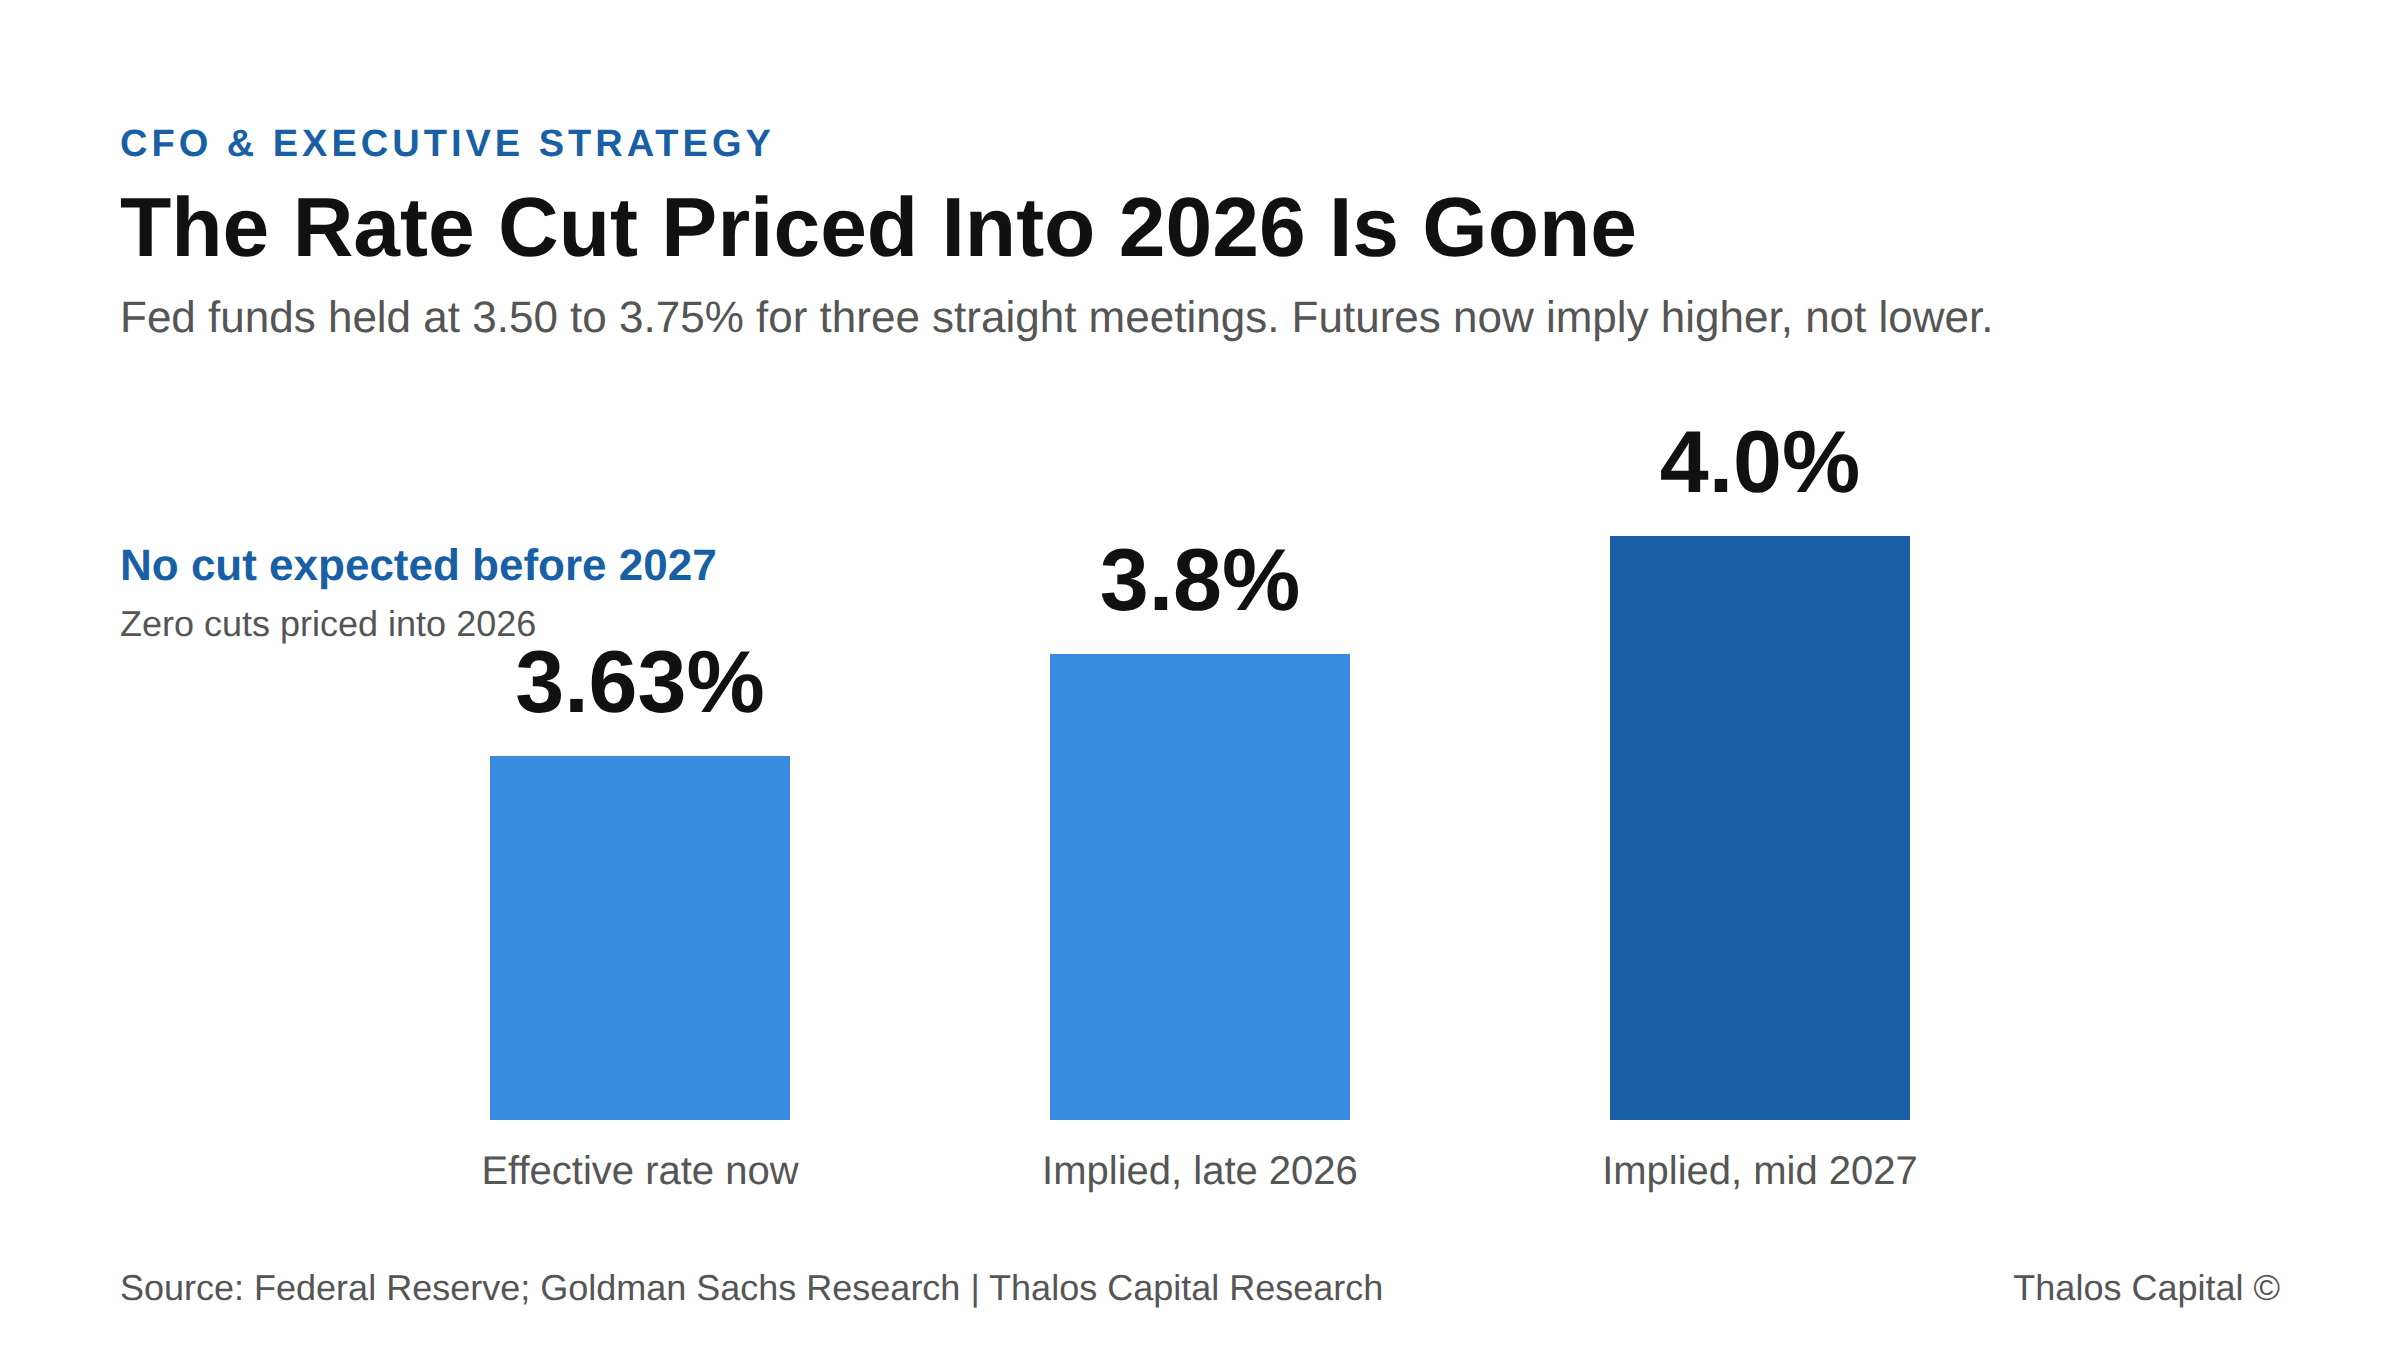
Bar chart showing the federal funds rate at 3.63% today, rising to an implied 3.8% by late 2026 and 4.0% by mid 2027, with no rate cut expected before 2027 according to futures pricing.

The Rate Cut Your Capital Plan Is Counting On Is Not Coming

The 2026 rate cuts your capital plan assumed are gone. The Fed is on hold, banks are tighter, and capital has shifted to private credit. How to structure financing for the rate environment that actually exists.
Read More
Working through a financing decision?
Insights are a starting point. A conversation maps your actual options.
Tell us what you are financing and we will map the structures and sources that fit.
Submit your financing request →
Explore our financing solutions
Equipment FinancingWorking CapitalAsset-Based LendingStrategic Debt